


Organize Your Data Effectively
Unlike spreadsheets or other scientific graphing programs, Prism has eight different types of data tables specifically formatted for the analyses you want to run. This makes it easier to enter data correctly, choose suitable analyses, and create stunning graphs.


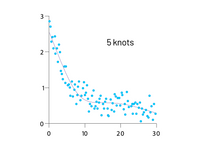
 - Dose Response Regression")
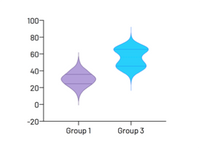
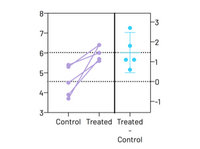
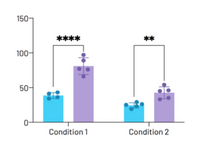
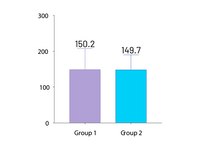
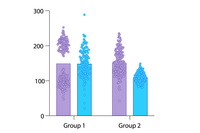
 - Comparison of Means")
