


Nowadays Quality by Design is a huge topic - especially in pharmaceutical appliocations. Not only being the recommended method for drug development by the FDA, it even gives you that much more flexibility in production and much more knowledge about your process than many other methods. In this piece I will go through the process of finding a design space using the QbD-methodology supported by Design-Expert. The whole example will be based on data provided by the FDA.

Recently we developed a whole new training on the statistical aspects - especially the Design-of-Experiments-part (DoE) - of QbD. I started familiarizing with the topic by reading the ICH-Guidlines (Q8-Q10) and was a bit disappointed. The guidelines seemed to be very liberal, allowing you to do what ever you want as long as it makes some sense. I - as a statistician - was hoping to find clear guidelines stating that you shall use Design of Experiments (DoE) as a very important tool when developing a drug.
If you read a bit further you will of course see that using DoE is the strong recommendation by ICH. Later on a colleague pointed me to a very nice example of the recommended QbD-approach - using DoE - by the FDA. On 107 pages the document (Quality by Design for ANDAs: An Example for Immediat-Release Dosage Forms) goes through the whole process of the development of a ANDA(Abbreviated New Drug Application)-drug-product. The document contains many examples of how to apply DoE in pharmaceutical applications. We decided to use multiple of those examples for our training and I want to use one of those in here, to show step by step how to reproduce the results in the document using Design-Expert. I will use Formulation Development Study #1 (starting on page 33) as our example.
Pre-Considerations
One of the most important steps when doing DoE is to select the right factors and the right ranges for those factors. In this example we are trying to find a design space that grants sufficient quality for the following response variables
- Dissolution at 30 min [Target: Maximize >= 80%]
- Tablet Content Uniformity CU [Target: Minimize % Relative SD < 5%]
- Powder blend flow function coefficient ffc. [Target: Maximize >6]
- Tablet Hardness at 10 kN [Target: Maximize >9kP]
Based on a formal risk assessment and previous screening-experiments the following factors have been chosen to be researched:
- Drug Substance PSD (Particle Size Distribution - d90, µm) in the range of 10 to 30
- Disintegrant (%) in the range of 1 to 5
- %MCC in MCC/Lactose combination in the range of 33.3 to 66.7
Setting up the Design
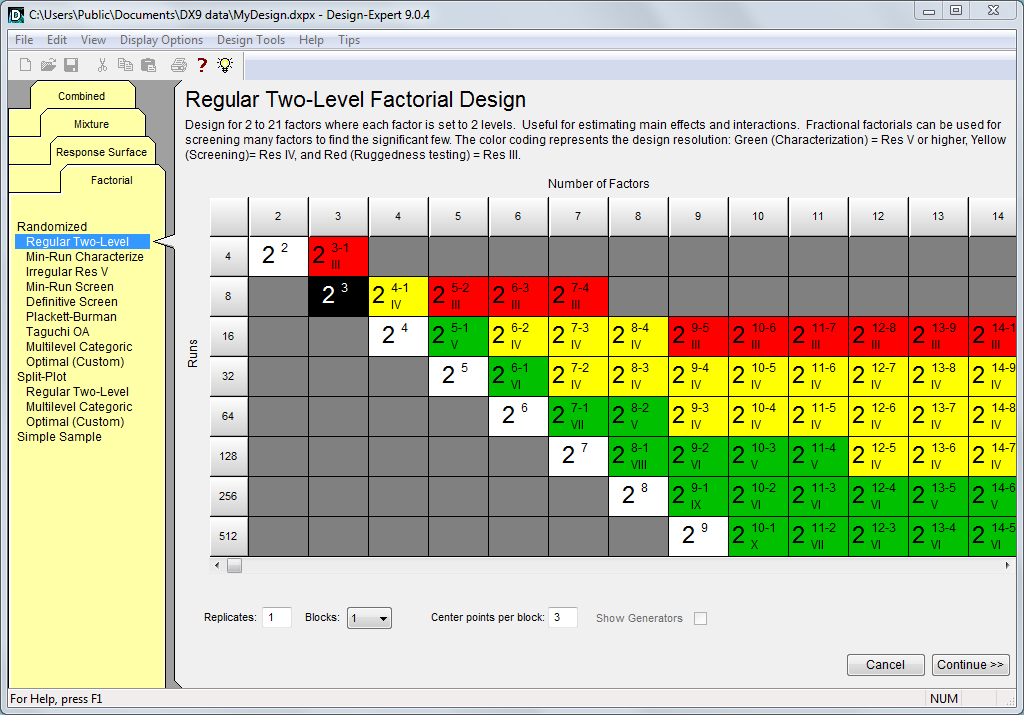
It's fairly simple to set up this design in Design-Expert. Just hit the New Design link, select the Factorial tab and in there Regular Two-Level. The design we need is the one for three factors using 8 experiments.


Analysis
Now we want to analyze the data. Design-Expert guides you nicely through the process. Just select the first of the responses on the left hand side and iterate with me through the individual steps.
- Transform Initially we don't want to transform our data. This might be an option if we detect specific problems with our models later on in the Diagnostics.
- Effects All effects that are in the top right of the half-normal-plot and do not fit to the line of the effects in the bottom left will be the important ones. Here it's quite obvious that PSD, Disintegrant and their interaction are important.

- ANOVA Here I just want to compare the FDAs report with our results (we'll only consider the blue, the adjusted model):
 |
| Design Expert Report |
 |
| FDA-Report |
- Diagnostic There is nothing suspicious in the diagnostics-tab, thus we might continue with the interpretation of the model in the model graphs. Design-Expert provides exactly the graph from the FDA-report (page 38).

Optimization
After going through the modeling step for each response we now can go on with the optimization or more precisely the definition of the design space. First we need to tell Design-Expert the acceptable ranges for each response. We do that in the Optimization => Graphical section on the left hand side in Design-Expert.


Design Space for high levels of %MCC in MCC/Lactose
If you enjoyed this intro to QbD and Design-Expert check out our free webinars that might go a bit deeper - especially on Design-Expert and DoE!