Productdetails
Design Expert
Best of breed in Design of Experiments!
Optimize your product or process with Design of Experiments (DOE). Design Expert offers features you will not find anywhere else in an incredibly easy-to-use format. This powerful program is a must for anyone wanting to improve a process or a product. With Design-Expert you can screen for vital factors, locate ideal process settings to achieve peak performance and discover your optimal product formulations. Interactive 2-D graphics support use of your mouse to drag contours or set flags that display coordinates and predicted responses. Rotatable 3-D plots make response visualization easy.
Developed with constant focus on the Usability
With annotated statistical analysis and an extensive context-sensitive help system, you can easily interpret the outputs. Furthermore the Design Wizards supports users who are new to the software or are just unsure where to start with their experiment. A short series of questions will guide them to the proper design.
Comprehensive and fully developed Functions
With the powerful optimization features in Design-Expert, you can maximize desirability for dozens of responses simultaneously. There are also unique tools for generating and graphing propagation of error (POE), thus allowing you to achieve six-sigma objectives for reducing variation. Maximize, minimize or hit targets with factor levels set to give you robust results.
Tremendous Variety of Designs Meet All Your Experimental Needs
- Standard two-level full and fractional factorials (up to 512 runs) for testing up to 21 factors simultaneously, now also with minimum-aberration blocking choices
- General (multilevel) factorial designs using factors with mixed levels
- Taguchi orthogonal arrays
- High-resolution irregular fractions, such as 4 factors in 12 runs
- Placket-Burman designs for 11, 19, 23, 27 or 31 factors in 12, 20, 24, 28, 32 or 64 runs respectively
- “Min-Run Res IV” (two-level factorial) designs for 5 to 50 factors: Screen main effects with maximum efficiency in terms of experimental runs.
- Response Surface Method (RSM) designs, including central composite (small, face-centered, etc.), Box- Behnken (3-level), hybrid and D-Optimal
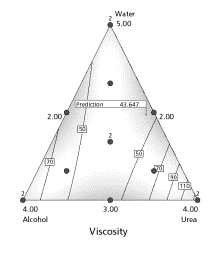
- Mixture designs, such as simplex-lattice, simplex-centroid screening (for up to 24 components) and D-optimal
- Combined mixture and process designs (mix your cake and bake it, too!)
- Ability to graph any two columns of data on the XY graph (this is a great way to view a blocked effect)
- Easy-to-use automatic or manual model reduction
- Ability to easily analyze designs with botched or missing data
Enjoy Incredible Flexibility in Design Modification
- Define your own generators for fractional factorial designs
- Impose linear multivariable constraints on RSM or mixture designs
- Add categorical factors to RSM, mixture or combined designs
- Create a factorial candidate set for RSM designs when only specific factor levels are available
- Ignore a row of data while preserving the numbers
Build Confidence with Statistical Analysis of Data
- If your model is aliased, a warning will pop up prior to viewing the ANOVA for two-level fractional factorials, allowing you to make substitutions for aliased effects
- Select optional annotated views for assistance interpreting the ANOVA
- Inspect F-test values on individual model terms and confidence intervals on coefficients
- Automatically select effects using Lenth's criteria or probability values
- Take advantage of new user preferences, for example, make a global change in the significance threshold (0.05 by default vs. 0.01 and 0.1)
Take Advantage of Powerful Tools for Response Modeling
- Change models from RSM to factorial and back and from Scheffe (mixture) to slack (during design building and at model selection)
- Add integer power terms to the model, for example, quartic
- Select terms for model, error, or to be ignored (allows analysis of split-plot and nested designs)
Simplify Interpretation with Terrific Graphics
- A quick summary of the design type as well as factor, response and model information is available by clicking on the design status node
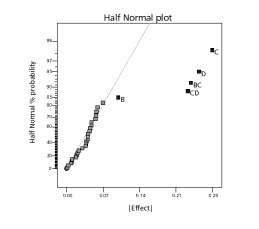
- Discover significant effects at a glance with half-normal or normal probability plots, made easier by including points representing estimates of pure error (if available from your design)
- See the Box-Cox plot for advice on the best response transformation
- View a complete array of diagnostic graphs to check statistical assumptions and detect possible outliers (bonus feature: predicted-versus-actual graphs with a 45º line)
- Graph alternative aliased interactions
- See the effects plot in the original scale after transforming the response
- Observe variation in predictions by viewing the least significant difference (LSD) bars on the model graphs
- Poorly predicted regions on contour maps are shaded to give you confidence in your predictions
- Slice your contour plots using a simple slide bar (and see actual design points when they're on a slice!)
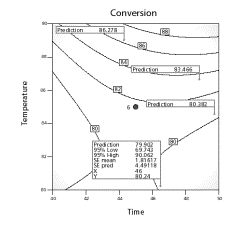
- Set flags to reveal the predicted response at any location
- Drag 2-D contours using your mouse
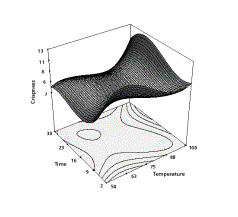
- Rotate 3-D graphics and see projected 2-D contours
- Edit colors, text and more to produce professional reports
- See all effects on one graph with trace and perturbation plots
- Plot the standard error of your design on any graph type (contour, 3-D, etc.)
- Maximize, minimize or target specific levels for both responses and factors
- Set weight and importance levels to prioritize responses for desirability
- Choose 2-D contour, 3-D surface, histogram or ramp desirability graphs
- Include categorical factors
- Set factors at constant levels
- Add equation-only responses, such as cost, to the optimization process
- Look at the overlay plot to view constraints on your process or formulation
- Predict responses at any set of conditions (including confidence levels)
- Discover optimal process conditions or formulations
Achieve "Six-Sigma" Goals
- Explore propagation of error (POE) for mixtures, crossed designs and transformed responses, as well as RSM
- For purposes of POE, enter your own response standard deviation or set it at zero


