Lorem ipsum dolor sit amet, consetetur sadipscing elitr, sed diam nonumy eirmod tempor invidunt ut labore et dolore magna aliquyam erat, sed diam voluptua
GraphPad Prism

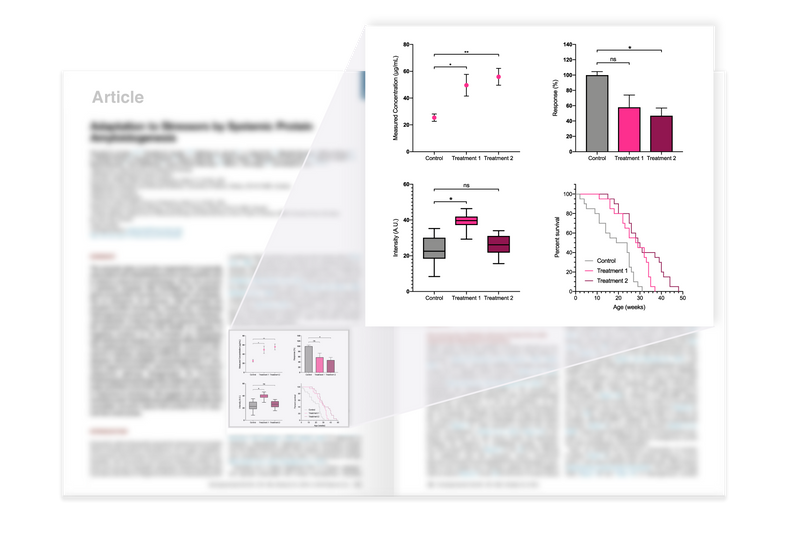
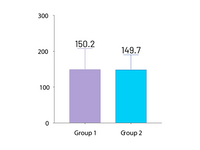
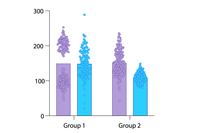
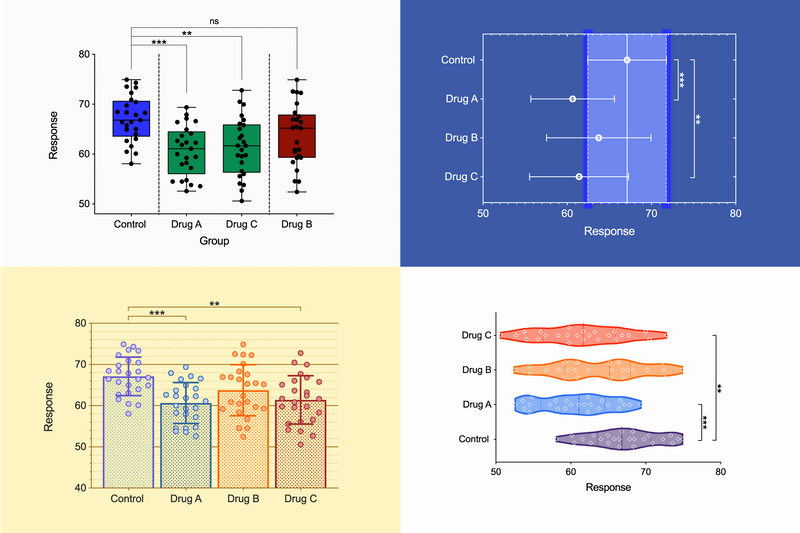


Product information "GraphPad Prism"
GraphPad Prism – The Leading Software for Data Analysis & Scientific Visualization
GraphPad Prism is the preferred statistics and graphing software designed specifically for scientific research. Researchers around the world use Prism to perform accurate data analysis, make informed statistical decisions, and present results in professional, publication-ready charts.
🚀 Save time and improve the accuracy of your analyses with GraphPad Prism!
Biostatistics & Data Analysis for Life Sciences
Originally developed for biology, medicine, and pharmacology, GraphPad Prism is now widely used across the life sciences—from students and PhD researchers to scientists in the pharmaceutical and healthcare industries.
✅ Easy-to-use statistical analysis tools for scientists
✅ Automated graphing for accurate data visualization
✅ Clear, easy-to-understand results interpretation
📌 No other software offers such intuitive and powerful curve fitting!
Powerful Statistical Tools in GraphPad Prism
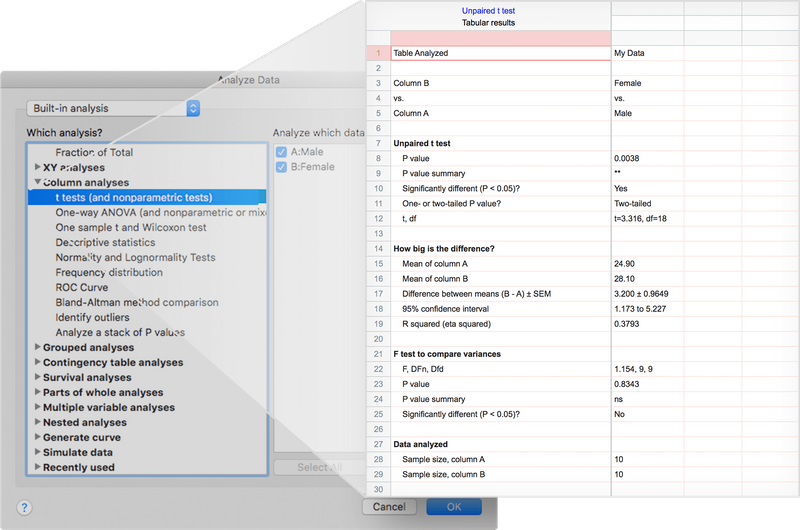
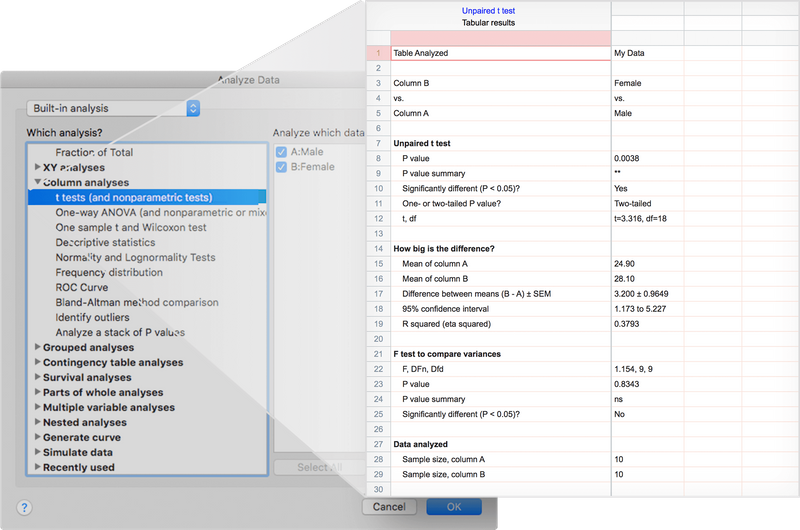
GraphPad Prism includes a wide range of statistical tests and regression models to help you analyze your research data precisely and confidently.
Included Statistical Methods:
📊 t-tests (unpaired & paired)
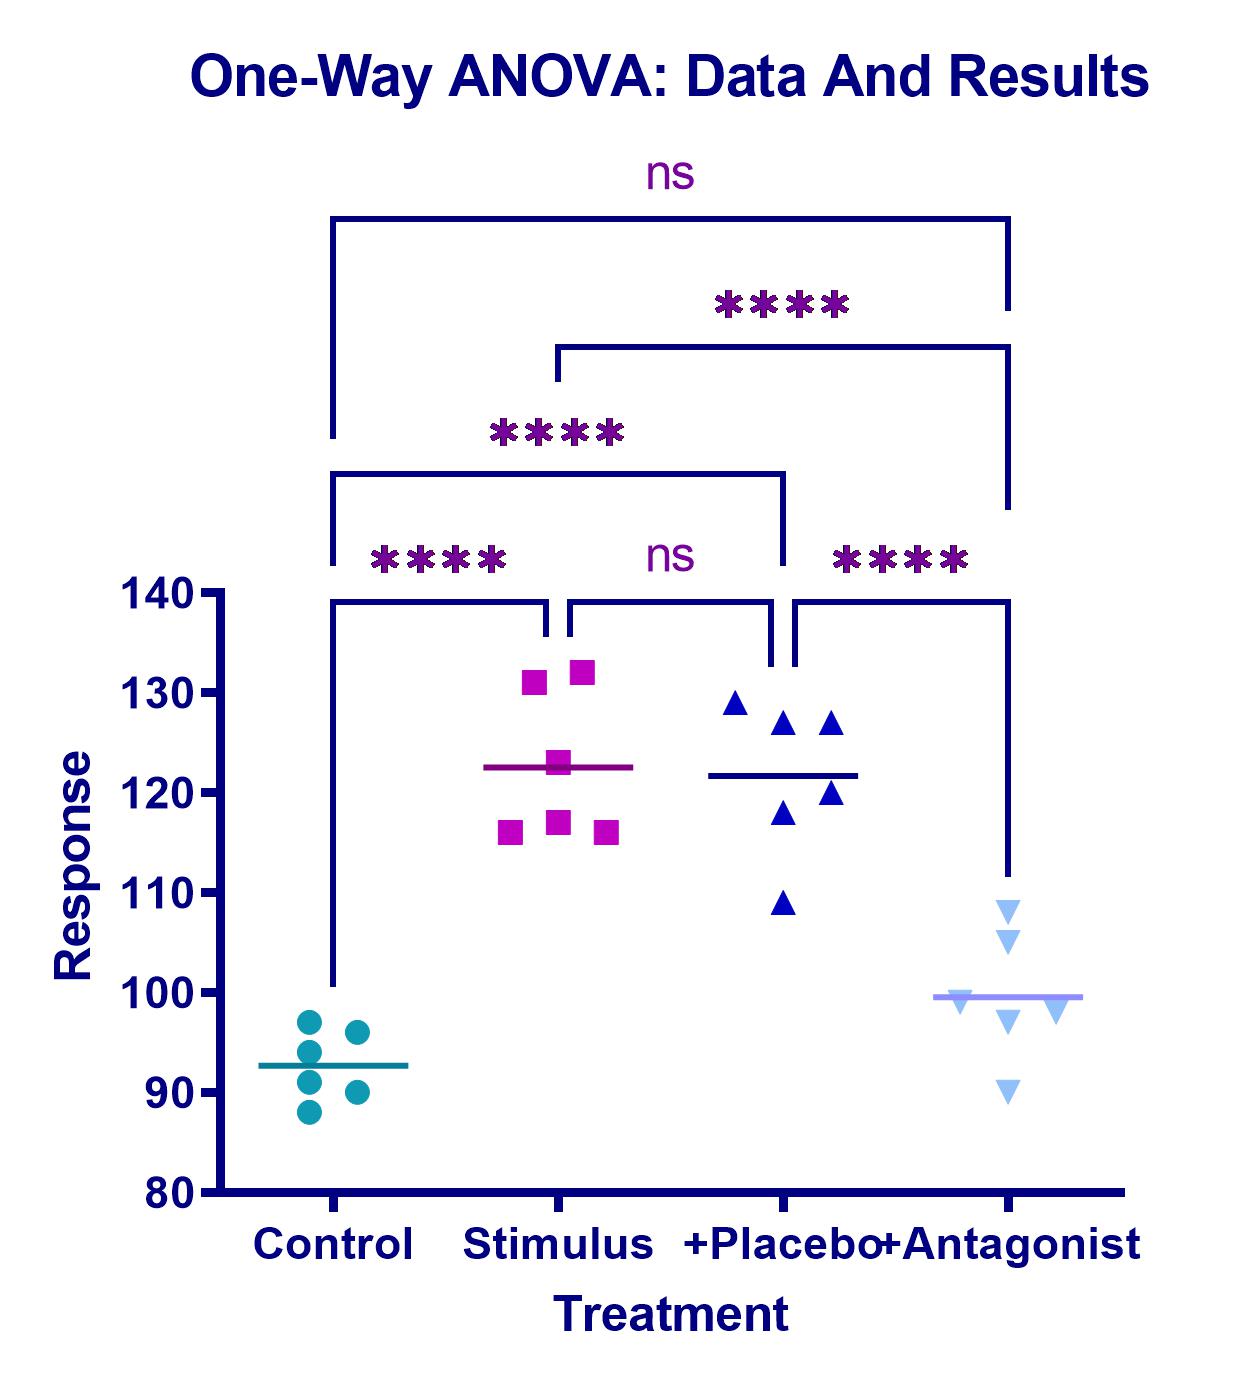
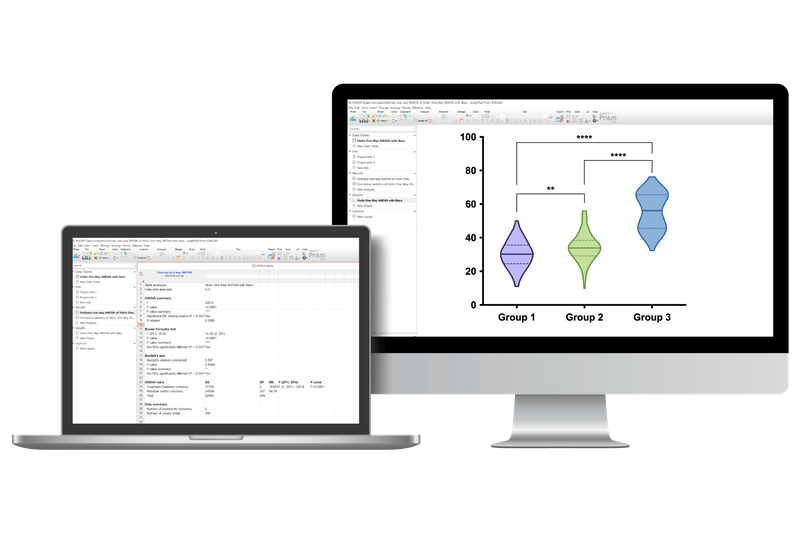
📊 ANOVA (one-way, two-way, three-way)
📊 Nonparametric tests
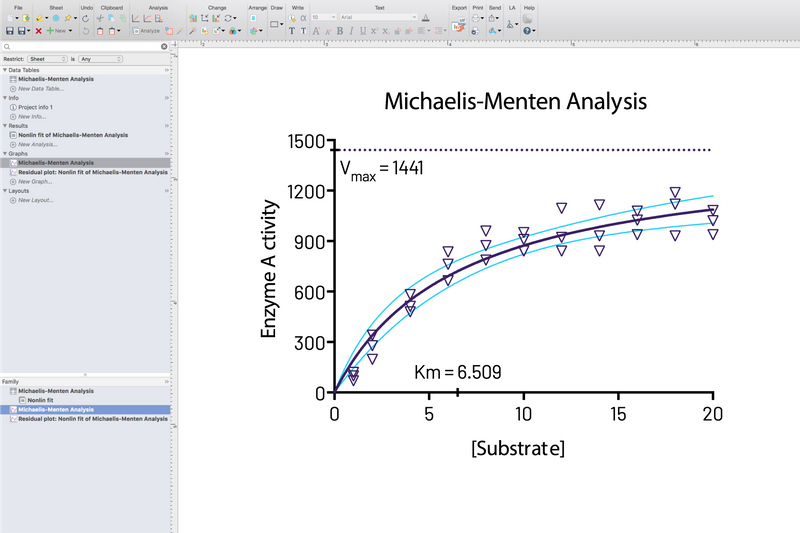
📊 Linear & nonlinear regression
📊 Survival analysis (Kaplan-Meier)
📊 Contingency table analysis
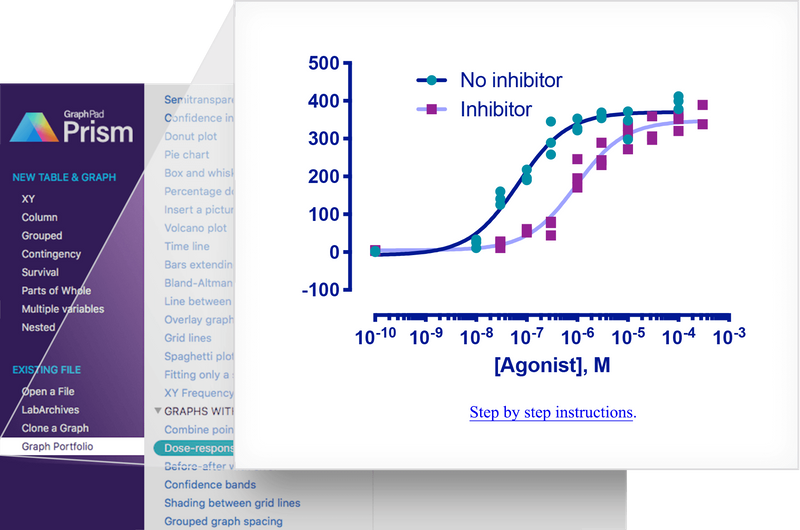
💡 Especially for nonlinear regression, Prism offers advanced tools to calculate EC50, fit complex models, and compare curves with ease.
Scientific Graphing with Flexible Chart Customization
With GraphPad Prism, you can create high-quality scientific graphs that update automatically when your data changes.
🎨 Graphing Highlights:
✅ Automatically generated graphs based on your analyses
✅ Fully customizable axes, colors, labels, and layouts
✅ One-click templates for professional, consistent output
📈 Create perfect scientific visuals in just a few clicks!
Why Choose GraphPad Prism?
🔹 Fast & easy data analysis for scientists
🔹 Automated statistics and charting for accurate research
🔹 Comprehensive tools for biostatistics & nonlinear regression
🔹 Intuitive interface – perfect for students and professionals alike
🚀 Get started with GraphPad Prism and take your scientific research to the next level!
📥 Download your free trial now:
➡ Learn more & get the free trial
🔥 Discover the New Features in GraphPad Prism!
📊 Enhanced Graphing and Customization Options
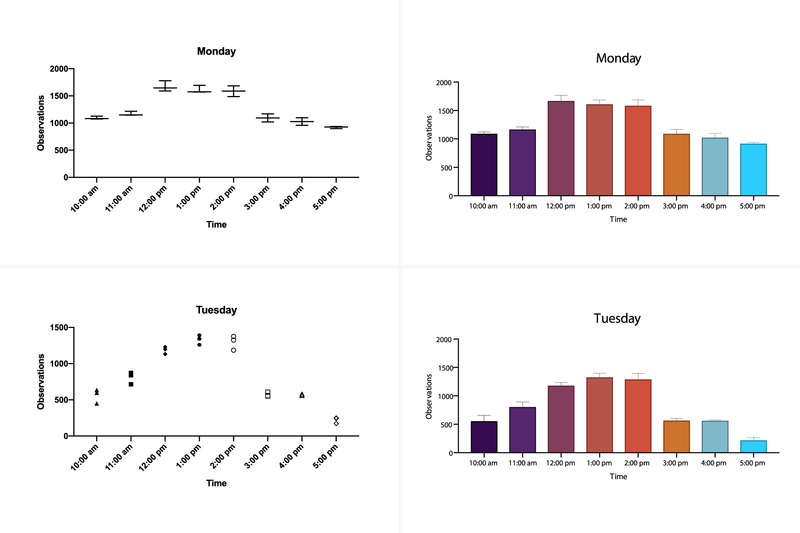
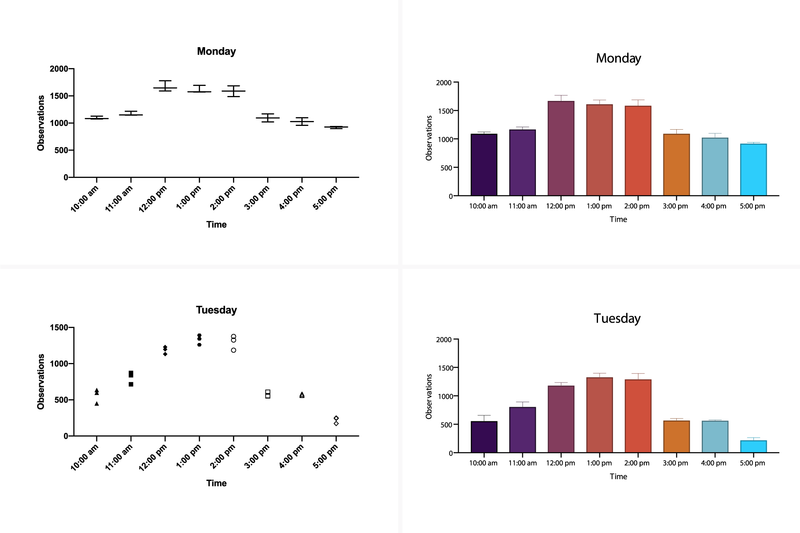
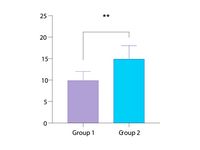
✔️ Automatic annotations for bar charts
➝ Instantly label your bars with means, medians, or sample sizes.
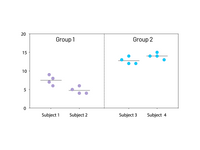
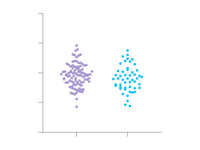
✔️ Improved grouped graphs
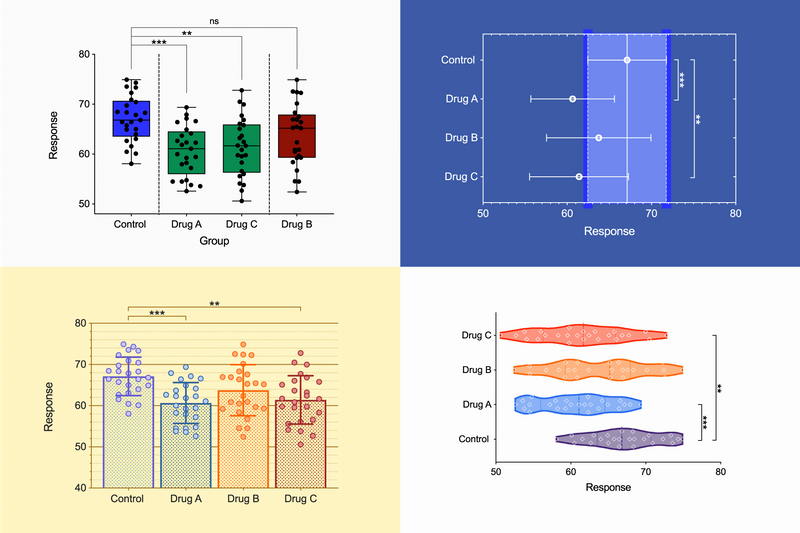
➝ Combine individual data points (scatter), bars for means or medians, and error bars for more accurate visual representation.
🎨 Advanced Data Visualization & Chart Customization
🟠 Bubble Plots
➝ Create bubble plots directly from raw data, mapping X, Y, size, and color to different variables.
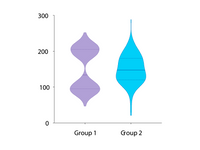
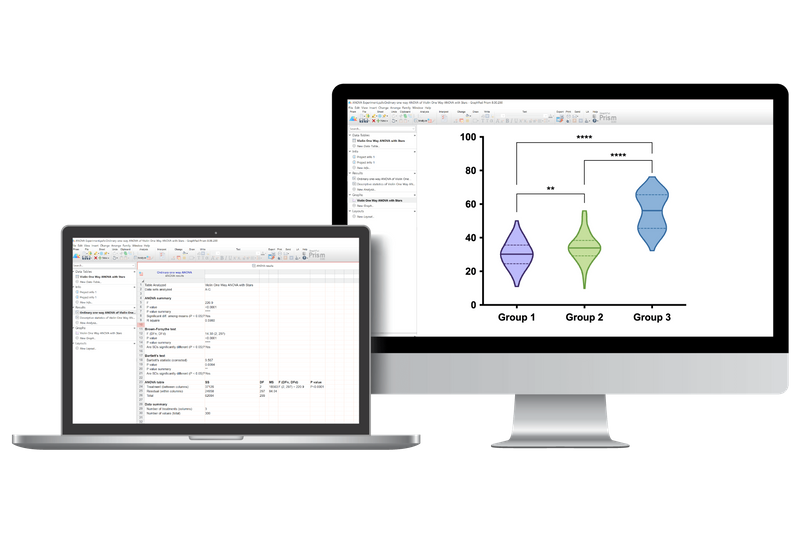
🟣 Violin Plots
➝ Visualize distributions of large datasets more effectively than with box or bar charts.
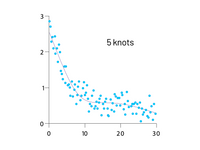
📈 Smoothing Functions for Trends
➝ Use Akima splines and smoothing splines for greater control over curve shapes and inflection points.
🚀 Smarter Navigation & User Experience
🔍 Improved Search Function
➝ Find sheets with highlights or notes in specific colors quickly.
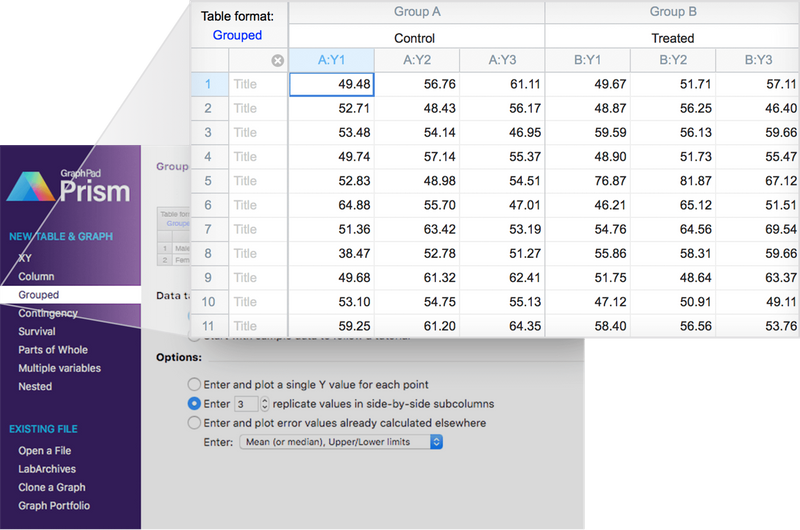
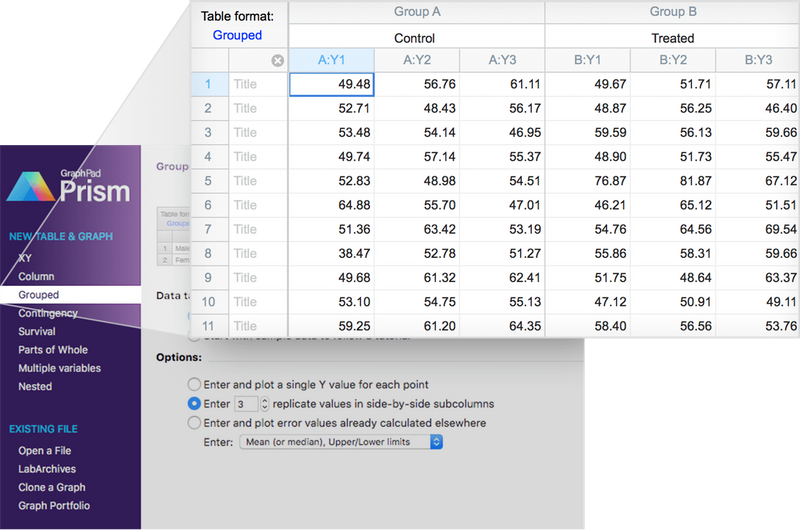
🗂 8 Table Formats
➝ Includes multivariate tables for multiple linear regression and nested tables for advanced ANOVA designs.
📑 Faster Result Interpretation
➝ Grouped result tables with tabbed navigation for better overview and organization.
📊 Expanded Statistical Methods
📌 ANOVA with repeated measures & missing values
➝ Automatically uses a mixed-effects model for more accurate results.
📌 Nested t-tests and ANOVA
➝ New table formats support nested t-tests, ANOVA, and Poisson regressions.
📉 Residual Plots for Multiple Analyses
➝ Test normality of residuals using four methods and visualize them in various graph types.
🎯 Boost Productivity with Smart Tools
⚡ Automate without coding
➝ Use templates, clone graphs, and apply consistent formatting with the "Magic" wand tool.
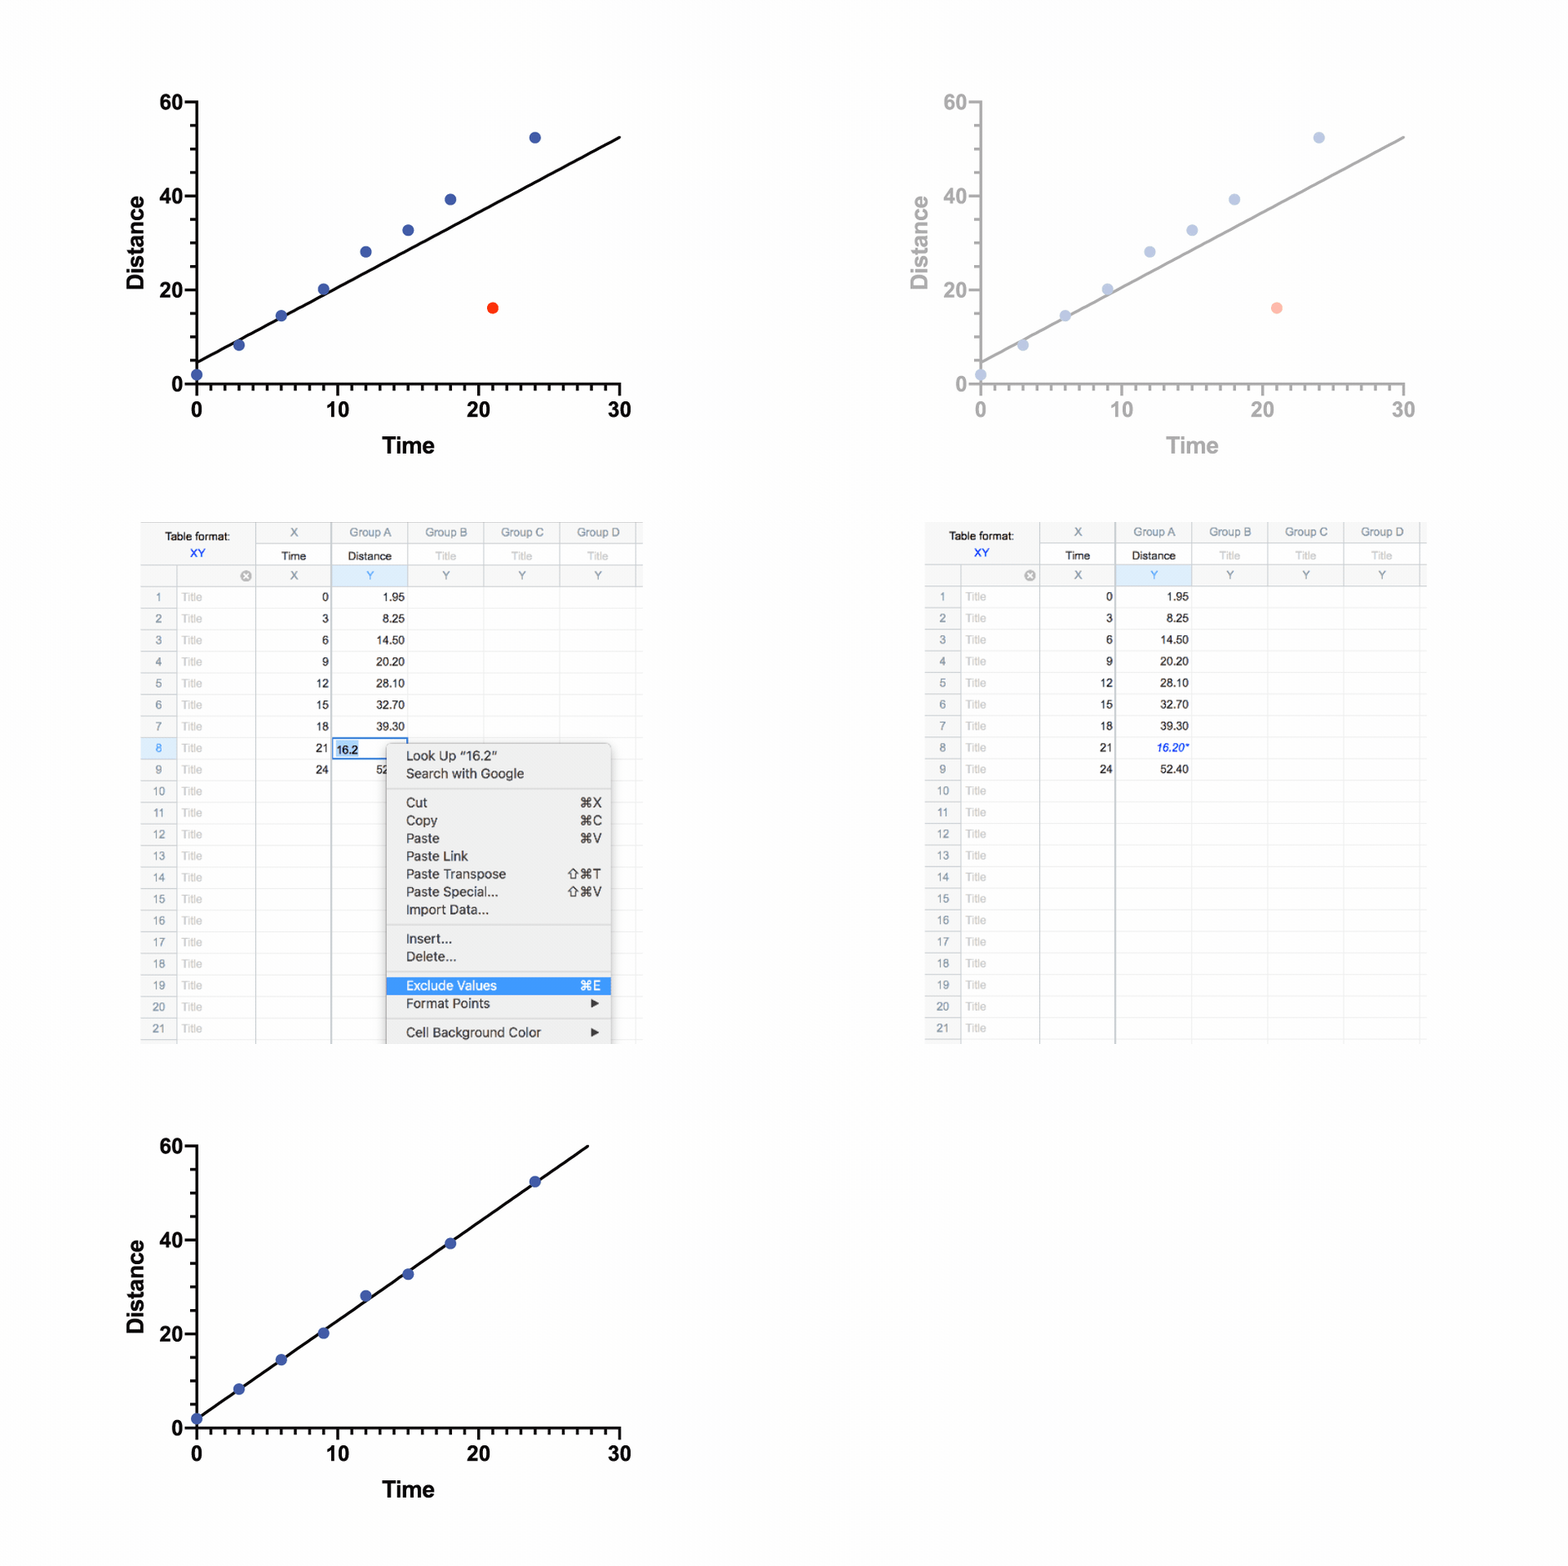
📊 One-Click Regression Analysis
➝ Choose a model – Prism does the rest: curve fitting, tables, and graphs in seconds.
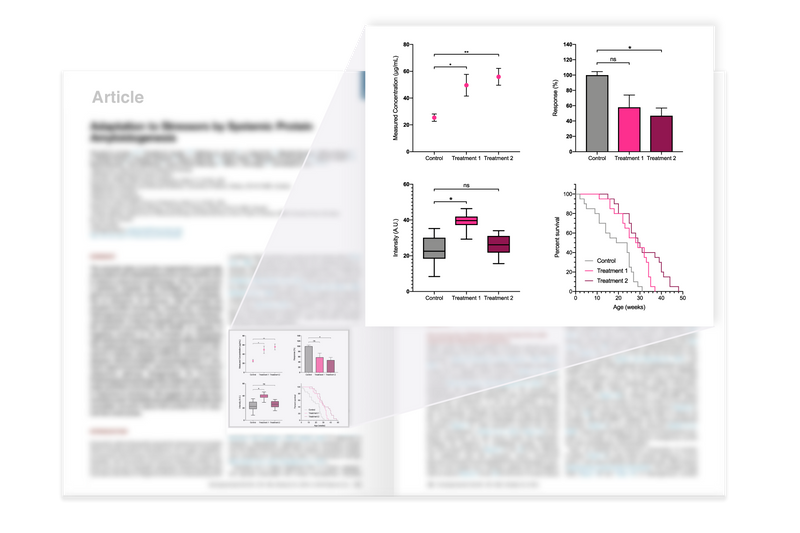
📢 Export publication-ready graphics with one click
➝ Fine-tune export settings for journals: file type, resolution, transparency, color space (RGB/CMYK).
💡 Improved Collaboration
➝ Share full project files including data, analyses, results, and graphs – all in one file.
📌 GraphPad Prism – The most powerful solution for statistical analysis and scientific data visualization.
🚀 Try it now and accelerate your research with greater efficiency and precision!
Systemvoraussetzungen der Software GraphPad Prism
| Windows® | Mac | |
| Betriebssystem | Windows 7, 8 und 10 (32-/64-Bit) | Läuft unter macOS X 10.9 (Mavericks) oder später. Unter macOS 10.8, scheint Prism zu laufen, aber die Version wurde nicht getestet und wir geben dafür keinen Support. Falls Sie 10.8 oder füher verwenden möchten, bitten wir Sie dringend ein Update des MacOS durchzuführen |
Bildschirmauflösung | mindestens 800 x 600 | mindestens 1024*768 |
| Festplattenplatz | 100 MB freier Speicherplatz auf der Festplatte | 130 MB freier Speicherplatz auf der Festplatte |
| Further Requirements | Prism muss sich mit dem Internet verbinden, um die Lizenz zu prüfen wenn sie erstmalig aktiviert wird sowie mindestens einmal alle 30 Tage bzw. alle 20 Programmstarts (je nachdem welches Ereignis früher eintritt). | Prism muss sich mit dem Internet verbinden, um die Lizenz zu prüfen wenn sie erstmalig aktiviert wird sowie mindestens einmal alle 30 Tage bzw. alle 20 Programmstarts (je nachdem welches Ereignis früher eintritt). |
Details
System Requirements for the software GraphPad Prism
| Windows | Mac | |
| Further Requirements | Must connect to the internet to verify the license when it is first activated and also at at least once every 30 days (or every 20 launches, whichever comes sooner). |
Must connect to the internet to verify the license when it is first activated and also at at least once every 30 days (or every 20 launches, whichever comes sooner). |
| Operating System |
Windows 7,8 and 10 (32-/64-Bit) |
Runs under macOS X 10.9 (Mavericks) or later. If you use macOS 10.8, Prism will launch and seems to run OK, but we haven’t tested Prism thoroughly under this version of macOS and can’t provide much support. If you use 10.8, we urge you to update MacOS. |
| Display Resolution | at least 800 x 600 pixels | at least 1024 x 768 pixels |
| Disk Space | 100 MB | 130 MB |
Life Science

