Productdetails
EViews
Forecasting within the Econometric Sector
EViews offers academic researchers, corporations, government agencies, and students access to powerful statistical, forecasting, and modeling tools through an innovative, easy-to-use object-oriented interface.
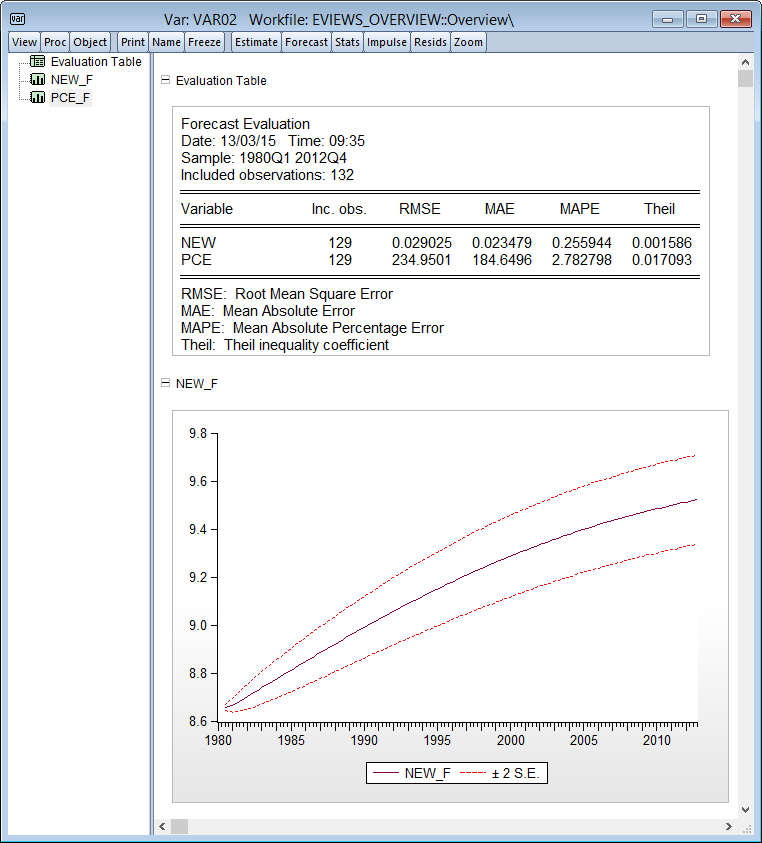
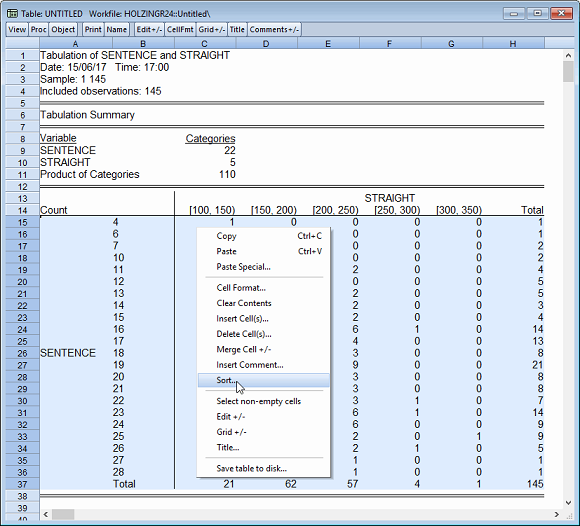
Its combination of power and ease-of-use make EViews the ideal package for anyone who works with time series, cross-section, or longitudinal data. With EViews, you can quickly and efficiently manage your data, perform econometric and statistical analysis, generate forecasts or model simulations, and produce high quality graphs and tables for publication or inclusion in other applications - just with mouse-clicks no complicated command language is needed!
Difference between EViews Standard and Enterprise Edition
EViews comes in two different editions: Standard and Enterprise. The Enterprise edition contains all the features of the Standard edition, but has some additional benefits:
- Database Connections
Whether you want to connect to a third party vendor, use ODBC to connect to a relational database, or use EViews’ Database Extension Interface (“EDX”) or EViews’ Database Object (“EDO”) Library to connect to your propriety data sources, EViews Enterprise is the tool for you!
- Third Party Vendors
With EViews Enterprise and an account with your data provider, you can seamlessly search, query, and retrieve data from third-party data sources such as Bloomberg databases, IHS databases, FactSet databases and many more.
EViews - Graphics
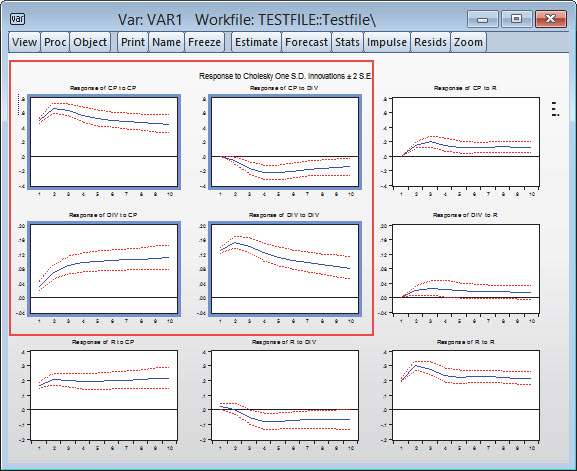
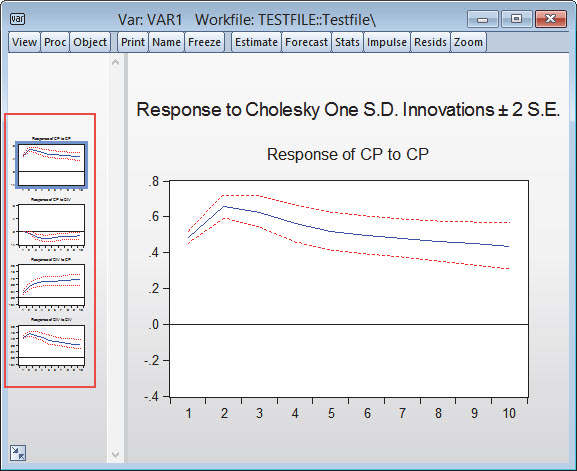
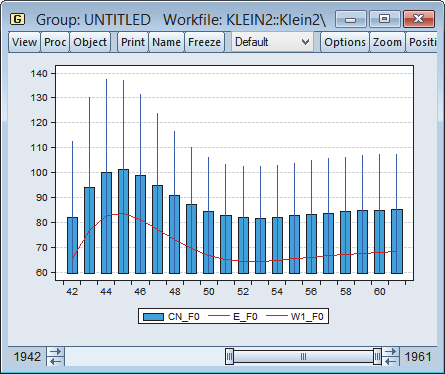
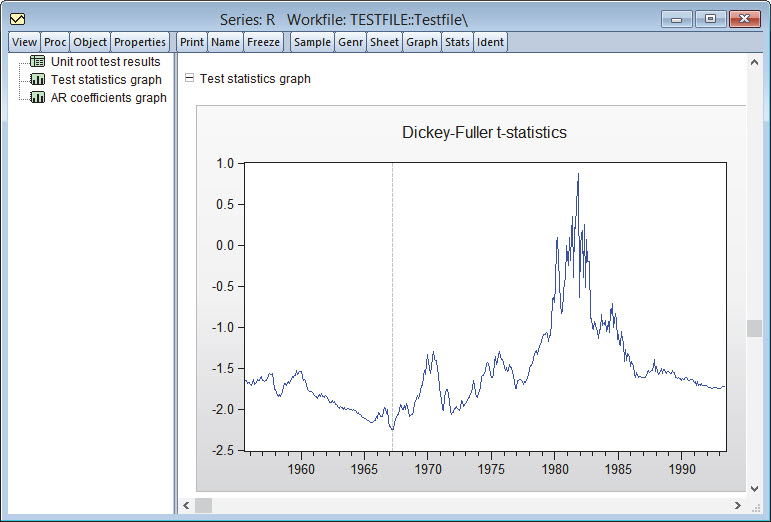
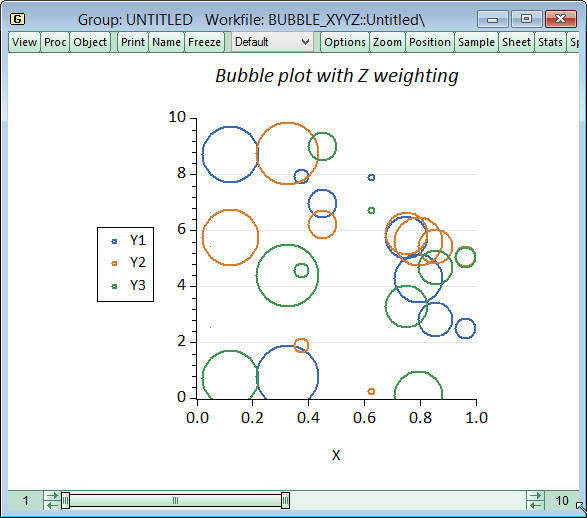
EViews supports a wide range of graph types including line graphs, bar graphs, pie charts, scatter diagrams, mixed line-bar graphs, high-low graphs, and scatterplots. A variety of options give you control over line types, color, border characteristics, headings, shading and scaling, including logarithmic scaling and dual scale graphs. Legends are automatically created and you can add labels in any scalable Windows fonts anywhere on your graph. Any number of graphs can be combined in a single graph for presentation. Customizing a graph is as simple as dragging graphic elements around the screen. Want to change the characteristics of a legend or a text label? Just click on it and your options are immediately presented in easy to understand dialogs. You can easily incorporate your customized graphs into other Windows applications using copy-and-paste, or by exporting Windows metafiles.
<
The IHS Global Link Model is the most comprehensive global macroeconomic model commercially available. With access through a unique desktop scenario application - the Economic Simulation Engine - IHS Global Link Model enables clients to generate macroeconomic scenarios and calculate their impact in minutes. Calculate in real-time global trends and prices of commodity, oil and gas, groceries, exchange rates and many more. All data of the IHS Global Link Model can be exported to the software EViews. Additionaly you get access to consulting via statistic- and analysis experts at IHS at any time.
Learn more about the Global Link Model!
Further Information:
- EViews-Homepage (IHS EViews)
- The manufacturer of EViews provides several Add-ins and Library Packages to increase the functionality of EViews.
EViews 10 Patch Installer
This update program file can be used to update your currently installed EViews 10 to the latest version. The following link takes you to the website of the manufacturer IHS:
http://www.eviews.com/download/ev10download.shtml


