What's New in PASS 2020?
|
PASS adds 38 new sample size procedures and 33 updated or improved procedures. Among the new and updated procedures are those for
|
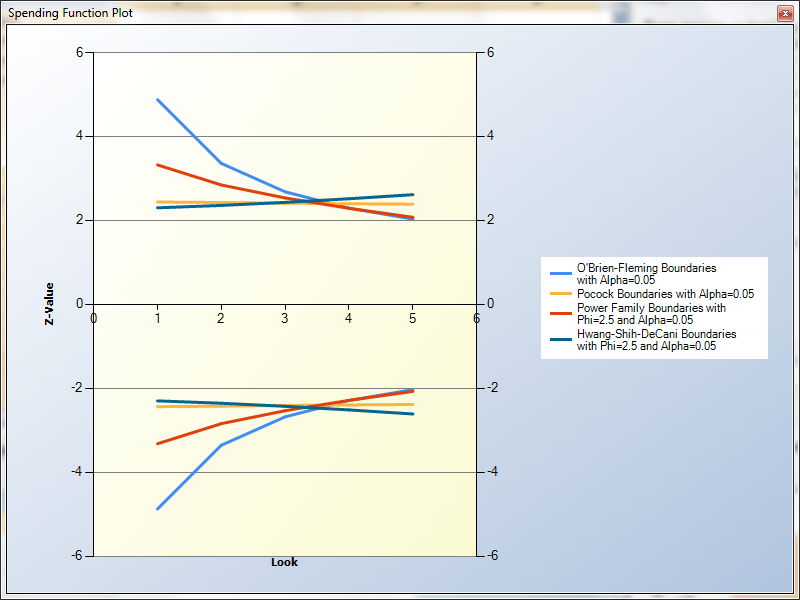
- Group-Sequential Tests for Hazard Rates, Means, and Proportions (Superiority and Non-Inferiority)
- GEE Tests for Means, Proportions, and Poisson Rates in a Cluster-Randomized Design
- Post-Marketing Surveillance for Poisson Rates
- Tests for Means and Proportions a Split-Mouth Design
- Confidence Intervals in Cluster and Stratified Designs
- Tests for Means and Proportions in Cluster-Randomized Designs
- Tests for Multiple Proportions and Poisson Rates
- Tests for One Exponential Hazard Rate
- Equivalence Tests for the Ratio of Two Means (Normal Data)
- Updated Randomization Lists (Block Randomization and Stratified Lists)
- Updated Conditional Power and Sample Size Re-estimation of Means, Proportions, 2×2 Cross-Over Designs, and Logrank Tests
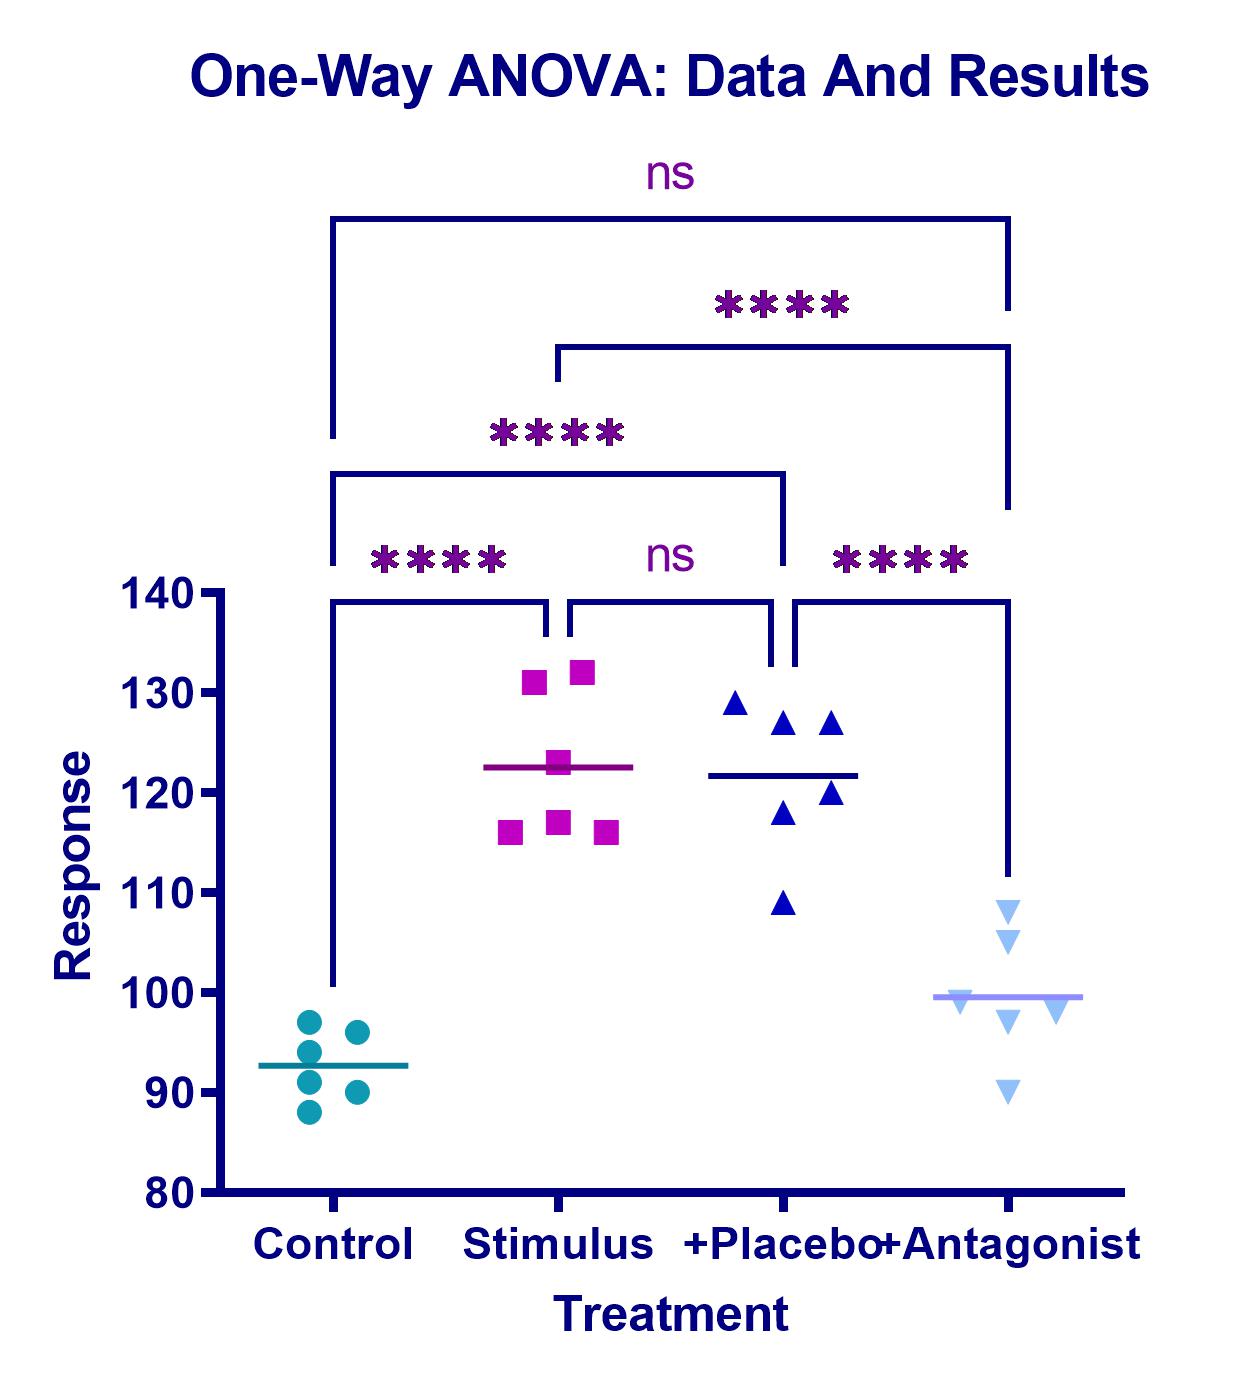
- Updated One-Way ANOVA
- Updated Simplified Simulation Procedures for One Mean, Paired Means, Two Means, and Mann-Whitney Tests
- Updated McNemar Test
- Updated Cochran-Mantel-Haenszel Test
For the 11 new group-sequential sample size procedures in PASS , there are corresponding group-sequential analysis and sample-size re-estimation procedures in NCSS
New Features in PASS
PASS adds over 55 new sample size procedures.
New Procedures
Logistic Regression
- Tests for the Odds Ratio in Logistic Regression with One Normal X (Wald Test)
- Tests for the Odds Ratio in Logistic Regression with One Normal X and Other Xs (Wald Test)
- Tests for the Odds Ratio in Logistic Regression with One Binary X and Other Xs (Wald Test)
Repeated Measures Slopes (GEE)
- GEE Tests for the Slope of Two Groups in a Repeated Measures Design (Continuous Outcome)
- GEE Tests for the Slope of Two Groups in a Repeated Measures Design (Binary Outcome)
- GEE Tests for the Slope of Two Groups in a Repeated Measures Design (Count Outcome)
- –
- GEE Tests for the Slope of Multiple Groups in a Repeated Measures Design (Continuous Outcome)
- GEE Tests for the Slope of Multiple Groups in a Repeated Measures Design (Count Outcome)
Repeated Measures Time-Averaged Differences (GEE)
- GEE Tests for the TAD of Two Groups in a Repeated Measures Design (Continuous Outcome)
- GEE Tests for the TAD of Two Groups in a Repeated Measures Design (Binary Outcome)
- GEE Tests for the TAD of Two Groups in a Repeated Measures Design (Count Outcome)
- –
- GEE Tests for the TAD of Multiple Groups in a Repeated Measures Design (Continuous Outcome)
- GEE Tests for the TAD of Multiple Groups in a Repeated Measures Design (Binary Outcome)
- GEE Tests for the TAD of Multiple Groups in a Repeated Measures Design (Count Outcome)
Hierarchical Design Comparisons using Mixed Models
- Mixed Models Tests for Two Means in a 2-Level Hierarchical Design (Level-2 Randomization)
- Mixed Models Tests for Two Means in a 2-Level Hierarchical Design (Level-1 Randomization)
- –
- Mixed Models Tests for Two Proportions in a 2-Level Hierarchical Design (Level-2 Randomization)
- Mixed Models Tests for Two Proportions in a 2-Level Hierarchical Design (Level-1 Randomization)
- –
- Mixed Models Tests for the Slope Difference in a 2-Level Hierarchical Design with Fixed Slopes
- Mixed Models Tests for the Slope Difference in a 2-Level Hierarchical Design with Random Slopes
- –
- Mixed Models Tests for Two Means in a 3-Level Hierarchical Design (Level-3 Randomization)
- Mixed Models Tests for Two Means in a 3-Level Hierarchical Design (Level-2 Randomization)
- Mixed Models Tests for Two Means in a 3-Level Hierarchical Design (Level-1 Randomization)
- –
- Mixed Models Tests for Two Proportions in a 3-Level Hierarchical Design (Level-3 Randomization)
- Mixed Models Tests for Two Proportions in a 3-Level Hierarchical Design (Level-2 Randomization)
- Mixed Models Tests for Two Proportions in a 3-Level Hierarchical Design (Level-1 Randomization)
- –
- Mixed Models Tests for the Slope Diff. in a 3-Level Hier. Design with Fixed Slopes (Level-2 Rand.)
- Mixed Models Tests for the Slope Diff. in a 3-Level Hier. Design with Random Slopes (Level-2 Rand.)
- Mixed Models Tests for the Slope Diff. in a 3-Level Hier. Design with Fixed Slopes (Level-3 Rand.)
- Mixed Models Tests for the Slope Diff. in a 3-Level Hier. Design with Random Slopes (Level-3 Rand.)
2×2 Cross-Over Design – Odds Ratio
- Tests for the Odds Ratio of Two Proportions in a 2×2 Cross-Over Design
- Non-Inferiority Tests for the Odds Ratio of Two Proportions in a 2×2 Cross-Over Design
- Superiority by a Margin Tests for the Odds Ratio of Two Proportions in a 2×2 Cross-Over Design
- Equivalence Tests for the Odds Ratio of Two Proportions in a 2×2 Cross-Over Design
2×2 Cross-Over Design – Proportion Difference
- Tests for the Difference of Two Proportions in a 2×2 Cross-Over Design
- Non-Inferiority Tests for the Difference of Two Proportions in a 2×2 Cross-Over Design
- Superiority by a Margin Tests for the Difference of Two Proportions in a 2×2 Cross-Over Design
- Equivalence Tests for the Difference of Two Proportions in a 2×2 Cross-Over Design
2×2 Cross-Over Design – Ratio of Poisson Rates
- Tests for the Ratio of Two Poisson Rates in a 2×2 Cross-Over Design
- Non-Inferiority Tests for the Ratio of Two Poisson Rates in a 2×2 Cross-Over Design
- Superiority by a Margin Tests for the Ratio of Two Poisson Rates in a 2×2 Cross-Over Design
- Equivalence Tests for the Ratio of Two Poisson Rates in a 2×2 Cross-Over Design
2×2 Cross-Over Design – Generalized Odds Ratio for Ordinal Data
- Tests for the Generalized Odds Ratio for Ordinal Data in a 2×2 Cross-Over Design
- Non-Inferiority Tests for the Generalized Odds Ratio for Ordinal Data in a 2×2 Cross-Over Design
- Superiority by a Margin Tests for the Gen. Odds Ratio for Ordinal Data in a 2×2 Cross-Over Design
- Equivalence Tests for the Generalized Odds Ratio for Ordinal Data in a 2×2 Cross-Over Design
Williams Cross-Over Design – Pairwise Proportion Differences
- Tests for Pairwise Proportion Differences in a Williams Cross-Over Design
- Non-Inferiority Tests for Pairwise Proportion Differences in a Williams Cross-Over Design
- Superiority by a Margin Tests for Pairwise Proportion Differences in a Williams Cross-Over Design
- Equivalence Tests for Pairwise Proportion Differences in a Williams Cross-Over Design
Williams Cross-Over Design – Pairwise Mean Differences
- Tests for Pairwise Mean Differences in a Williams Cross-Over Design
- Non-Inferiority Tests for Pairwise Mean Differences in a Williams Cross-Over Design
- Superiority by a Margin Tests for Pairwise Mean Differences in a Williams Cross-Over Design
- Equivalence Tests for Pairwise Mean Differences in a Williams Cross-Over Design
Multiple Correlated Proportions (Stuart-Maxwell Test)
- Tests for Multiple Correlated Proportions (Stuart-Maxwell Test)


