Systat kaufen
0


Gesamtsumme
inkl. 19 % USt

Systat ist ein Pionier in der statistischen Datenanalyse und wissenschaftlichen Visualisierung. Systat unterstützt eine Vielzahl von Funktionen, das Anwendungsgebiet ist demnach entsprechend groß.

Systat ist umfangreich!

Systat bietet eine unerreichte Vielfalt an wissenschaftlichen und technischen Graph-Optionen. Mit der Erstellung von individuellen Graphen werden Ihre Ergebnisse aussagekräftiger. Systats 2D und 3D Graphiken sind sofort publikationsreif und können für entsprechende Präsentationen verwendet werden. Mit mehr als einer halben Million Nutzern in Forschungsinstituten, Universitäten und Laboren weltweit findet es in der statistischen Analyse eine breite Zustimmung. Mit Systat erzielen Sie auch bei extremen Daten aussagekräftige Ergebnisse. Bootstrapping ist für alle statistischen Prozeduren verfügbar.

Kostengünstig und Effizient!

Mit dem Programm analysieren Sie nicht nur einfache und komplexe lineare varianzanalytische und Regressions Modelle sondern sondern auch multivariate Datenstrukturen. Multivariate Verfahren wie z.B. Mulitdimensionale Skalierung, Faktor- und Hauptkomponentenanalyse und Clusterverfahren sind implementiert. Natürlich fehlen auch Kreuztabellenstatistiken, Lebensdauer- und Zeitreihenanlyse nicht. Systat ist mit Hilfe eine mächtigen Skriptsprache automatisierbar. Systat ist kostengünstig und effizient, überzeugen Sie sich selbst!

Argumente für Systat:

  • Es lassen sich einfache und komplexe lineare varianzanalytische und Regressions Modelle analysieren
  • Multivariate Verfahren wie z.B. Mulitdimensionale Skalierung, Faktor- und Hauptkomponentenanalyse und Clusterverfahren
  • Bootstrapping
  • Präsentationsfähige Graphen

Dies könnte Sie auch interessieren

SPSS Statistics - Standard

SPSS Statistics - Standard

SPSS Statistics - Standard

Elementare Analysefunktionalität für eine breite Vielfalt von Unternehmens- und Forschungsfragen. Mehr Details

Download Preisliste Zum Produkt

SPSS Statistics - Professional

SPSS Statistics - Professional

SPSS Statistics - Professional

Das umfangreiche und mächtige Paket zur statistischen Datenanalyse! Mehr Details

Download Preisliste Zum Produkt

SPSS Statistics - Premium

SPSS Statistics - Premium

SPSS Statistics - Premium

Umfassende Edition für Großunternehmen mit breit gefächerten Analyseanforderungen. Mehr Details

Download Preisliste Zum Produkt

SYSTATs

SYSTAT continues the legacy of Dr. Leland Wilkinson, who created SYSTAT over twenty years ago and who pioneered programmable graphs for statistical visualization. SYSTAT continues this tradition of state-of-the-art intelligent statistical graphing with significant graph enhancements, including greater interactivity, editability and customizability. And continuing its reputation of well-thought-out analytics, SYSTAT contains major new statistical features which include

  • Forecast time series error variance with ARCH and GARCH,
  • Examine the fitness of statistical models using Confirmatory Factor Analysis,
  • Develop complex prediction models with Polynomial Regression,
  • Environment Variables in Best Statistics
  • Additions to Existing Functionality, such as ANOVA,Bootstrapping, Crosstabulation, Fitting Distributions, Hypothesis Testing, Non-Parametric Testing and Enhanced Logistic Regression.

Furthermore SYSTAT brings enhancements concerning its graphical capabilities and the ability to handle even larger datasets than before. It can compute statistical methods up to 10 times faster than older versions on most problems.
These put SYSTAT at the leading edge of professional statistical analyses. It is not only a package for the statistically-savvy scientist, but is also accessible to a novice data analyst. Its output is stunning and is in a form ready to submit for publication.

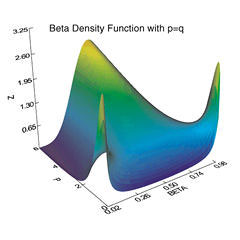
Beta Density Function

SYSTAT has every statistical procedure you need

SYSTAT is a powerful statistical software that has every statistical procedure you need to carry out efficient statistical analysis of your data. It provides you with features from the most elementary descriptive statistics to very advanced statistical methodology based on sophisticated algorithms. If you are a novice statistical user, you can work with its friendly and simple menu-dialog. If you are a statistically-savvy user, you might prefer to use its intuitive command language, and analyze your data swiftly and with ease. In either case, you can exploit its staggering range of powerful techniques to analyze many types of data to answer many types of questions. You can carry out very comprehensive analysis of univariate and multivariate data based on linear, general linear, and mixed linear models. You can carry out different types of robust regression analysis when your data are not suitable for conventional multiple regression analysis. You can also compute partial least-squares regression. You can design experiments, carry out power analysis, do probability calculations on a whole lot of distributions and fit them to data. You can perform matrix computations. Anything else you may need---Time Series, Survival Analysis, Response Surface Optimization, Spatial Statistics, Test Item Analysis, Cluster Analysis, Classification and Regression Trees, Correspondence Analysis, Multidimensional Scaling, Conjoint Analysis, Quality Analysis, Path Analysis, etc., etc.---SYSTAT has them all.

SYSTAT's Monte Carlo module helps you accomplish your simulation tasks

You can use the powerful Mersenne-Twister random number generator for your bootstrap and simulation tasks. You can exploit SYSTAT's random number generator from as many as 43 univariate and multivariate, discrete and continuous distributions for your Monte Carlo exercises. When the distributions are more complicated, use Rejection Sampling and Adaptive Rejection Sampling to draw random samples. For your complex Bayesian computations, suitably adapt SYSTAT's generic Markov chain Monte Carlo (MCMC) procedures like various types of Metropolis-Hastings and Gibbs Sampling features to draw random samples and to carry out Monte Carlo integration thereof.

SYSTAT can produce for you attractive graphs quickly and conveniently

SYSTAT offers a large variety of scientific and technical graphing types and a great deal of interactivity to help you produce just the right type of graph and customize it to accompany your analysis. Use the Interactive Graphics Dialog to change multiple aspects of your graphics using a single integrated dialog. Compare subgroups, overlay charts, transform coordinates, add geographic projections, change colors, symbols, and more, to create insightful presentations. Change graph locations, point-and-click to alter axis labels, scales, colors and symbols. Create unique graphs that bring out the important features in your data with advanced chart options including normal and kernel densities, multiplots, maps, Voronoi tessellations, function plots, contours, scatterplot matrices with 20 diagonal density choices and 126 nonparametric smoothing options, just to name a few. Speed up your analysis by rotating your 3-D graphs to visually determine the perfect power or log transformation to normalize your data using the Dynamic Explorer. Present visually useful and attractive summary of large data using hexagonal binning.

With SYSTAT, you need less effort to get meaningful results

Save time and effort with SYSTAT's informative Startpage. Work with its clear, comprehensive dialogs or with its interactive, intuitive, and easy-to-learn command language. You can work faster combining these two modes with the interlinked Command Line Interface and Menu-Dialog. Save time and effort with the Autocomplete facility. Ease your way through analyses with theme menus, customizable menus, and toolbars. Get more flexible output with longer variable names. Speed up your analysis using data and variable tabs. Save useful data file and variable information in the data file itself. Quickly navigate through detailed results using the browser-style Output Organizer. Instantly visualize your results with automatically produced Quick Graphs. Run the same analysis with ease on different data sets using token variables and command templates. Use the command log to track and report your statistical methodology. Produce publication-quality output and graphs.

You can customize almost any aspect of SYSTAT

You can reorganize almost any aspect of SYSTAT to suit your style of work and your needs. You can customize various elements of its interface. You can customize menu and toolbars to make often-used items immediately accessible. You can choose the appearance of your output in respect of fonts, width, spacing, style, etc. You can make your graphs look as you want them to in respect of color, background, pattern, surface style, line style, symbol style, and label style. You can customize commandspace, output organizer, keyboard shortcuts, actions of buttons, etc.

SYSTAT gives you a variety of help to make your work smooth and easy

Innumerable items of Help make the job of understanding and running SYSTAT much easier, faster, and error-free. They are available at your fingertips or at the click of the mouse. Some of them are: Tip of the Day, Bubble Help, F1 Help, Tooltips, Index, Glossary, Expanded Status Bar Help, Recent Files on Start Page, Theme Menus, Examples tab, Autocomplete, Acronym Expansions, Online Tutorial. Furthermore, there are about 600 examples available online with their command files and annotated data files, for you to study and emulate. And there are over 4300 pages of the manual available as online pdf files and in printed form.

SYSTAT Grafiken

SYSTAT Function Plots

SYSTAT Maps

SYSTAT Multivariate Displays

SYSTAT Probability and Quantile Plots

SYSTAT Quality Charts

SYSTAT Scatter Plots

SYSTAT Summary Charts

Weitere Informationen

Systemvoraussetzungen:

  • Windows 10, 8.x,  7, Windows Vista, 95, 98, NT and XP (32 bit)
  • Pentium or Pentium clone or higher
  • 32 MB RAM minimum (64 MB RAM for wavelet and production facility recommended)
  • 25 MB hard disk space
  • SVGA and above

New Statistics Features in SYSTAT

Forecast Time Series Error Variance with ARCH and GARCH
Conventional time series and econometric models assume that the conditional variance of a series is consistent over time, which may not always be true. ARCH and GARCH models use the past disturbances and variances in your time series data to accurately describe and account for future volatility.

Find the Best Predictors with Best Subsets Regression
BSR seeks to identify a small number of the best predictors in a trial set. It is especially helpful in situations where it might not be clear which predictors will end up being the most useful, especially in the areas of economics, ecology and the environment.

Examine the Fitness of Statistical Models Using Confirmatory Factor Analysis
SYSTAT’s Confirmatory Factor Analysis makes it easier to develop surveys, and test the fitness of behavioral, economic, marketing and social research models.

Explore SYSTAT’s Improvements to Its Existing Statistical Methods
Enjoy more robust testing, regression and cross-tabulation features with SYSTAT. Some of the new improvements include:

  • Hypothesis testing now includes testing for mean vectors, univariate bootstrapping,
  • and a new column-based input layout.
  • Polynomial Regression offers you useful and accurate prediction models for
  • curvilinear-related variables.
  • Non-parametric Test Suite now includes:
    • Jonckheere-Terpstra and Flinger-Wolfe tests for structured treatment appli-
    • cations
    • New multiple comparison tests (Dwass-Steel-Critchlow-Flinger, Conover-Inman and Conover)


New Graphics Features in SYSTAT

Add Polish to Your Research with Stunning 2D and 3D Graphs
SYSTAT renders visually compelling 2D graphics perfect for publication, and incredible 3D graphics that bring an incredible wow-factor to any research or business presentation.

Create and Edit Graphs with Ease Using SYSTAT’s Graphics Tools
SYSTAT comes packed with new graphical editing features, such as:

  • Richer Color Choices: Specify any color for your graphs from their red, green and blue component values.
  • New Editing Capabilities: Edit graph size, color, axes, legends, border display, etc. using interactive dialog boxes.
  • New Color Gradient Editing: SYSTAT gives you precise control over gradient color and style on 3D graph surfaces.
  • New Graph Labeling Features: Generate numeric case labels in plots, multivariate displays and maps. Label the dots in dot plots.

Enhancements concerning SYSTAT's Data Processing

Analyze Larger Data Sets with Greater Speed
SYSTAT has been engineered to handle even larger datasets than before. SYSTAT computes statistical methods up to 10 times faster than older versions on most problems.

Speed Up Scripting and Data Entry with Enhanced Auto-complete and Token Dialog
Enter SYSTAT script commands easily and avoid spelling errors with SYSTAT’s enhanced auto-complete functionality. Get automatic options for file and variable names and option values. Also, SYSTAT features a token dialog, allowing you to select variable value options from drop-down menus during data entry. SYSTAT gives you greater control over the data entry process, drastically reducing entry error.

Secure Your Work with SYSTAT’s Rescue Report
Rescue Report saves your data, commands and outputs in the event of a system crash or reboot. With the Rescue Report Dialog, you receive options on restoring your session. Also, your data, command and output files will be automatically attached to an email so that the SYSTAT support team can provide you with fast help.

Experience the Enhanced Look and Feel
SYSTAT features a completely rebuilt data editor which gives you greater control and flicker-free viewing. Also, a Data Navigation Toolbar has been added to allow you to jump easily to any desired case of any specific variable. The SYSTAT interface and dialog boxes have been updated to give you a better overall user experience.

Customize SYSTAT Menus and Configuration with New Themes
Choosing from SYSTAT’s pre-configured themes is easier than ever. SYSTAT displays all themes available for download, and gives expanded information on each theme. Choose form one of our many options, or configure your own customized look and feel.

Probability Calculator

  • Computes probability density function, cumulative distribution function, inverse cumulative distribution function, and upper-tail probabilities for 9 univariate discrete and 28 continuous probability distributions
  • Quick Graphs: graphs of the probability density function and the cumulative distribution function for continuous distributions

Random Sampling

  • Mersenne-Twister random number generator
  • Random Sampling from a list of 9 univariate discrete, 28 univariate continuous and 5 multivariate distributions with given parameters

Design of Experiments

  • Choose between Classic and Advanced DOE with dynamic wizard
  • Optimal Designs
  • Complete and incomplete factorial designs
  • Latin square designs, 3-12 levels per factor
  • Box and Hunter 2-level incomplete designs
  • Taguchi designs
  • Plackett and Burman designs
  • Mixture: lattice, centroid, axial, and screening
  • Response surface designs: Box-Behnken and central composite designs

Power Analysis

  • Determine sample size to achieve a specified power
  • Determine power for a single sample size or a range of sample sizes
  • Proportions, correlations, t-tests, z-tests, ANOVA (one-way and two-way), and generic designs
  • Conforms to the Hypothesis tests on means and their various options
  • One-sided and two-sided alternatives
  • Quick Graph: power curve

Descriptive Statistics

  • Column
    • Arithmetic mean, median, sum and number of cases
    • Min, max, range and variance
    • Coefficient of variation, std err of mean
    • Adjustable confidence intervals of mean
    • Skewness, kurtosis, including standard errors
    • Shapiro-Wilk normality test
    • Anderson-Darling normality test
    • Multivariate skewness and kurtosis, testing for significance of these
    • Henze-Zirkler test for multivariate normality
    • N- & P- Tiles: Cleveland, Weighted average 1, Weighted average 2, Weighted average 3, Closest, Empirical CDF, Empirical CDF (average),
    • Trimmed, Geometric, and Harmonic means
    • Stem-and-Leaf display
    • Resampling - Bootstrap, without replacement, Jackknife
    • Bootstrap estimates, bias, standard error and confidence intervals, histograms of estimates
  • Row
    • Arithmetic mean, median, sum and number of cases
    • Min, max, range and variance
    • Coefficient of variation, std err of mean
    • Adjustable confidence intervals of mean
    • Skewness, kurtosis, including standard errors
    • Shapiro-Wilk normality test
    • Anderson-Darling normality test
    • Multivariate skewness and kurtosis, testing for significance of these
    • Henze-Zirkler test for multivariate normality
    • N- & P- Tiles: Cleveland, Weighted average 1, Weighted average 2, Weighted average 3, Empirical CDF, Empirical CDF (average), Closest
    • Trimmed, Geometric, and Harmonic means
    • Stem-and-Leaf display
    • Resampling - Bootstrap, without replacement, Jackknife
    • Bootstrap estimates, bias, standard error and confidence intervals, histograms of estimates

    Fitting Distributions

    • 9 discrete and 21 continuous univariate distributions with given or estimated parameters
    • QuickGraphs: graph of the respective observed and expected frequencies while fitting
    • Chi-squared and Kolmogorov-Smirnov goodness-of-fit tests; Shapiro-Wilk normality test for normal, lognormal and logit normal

    Crosstabulation and Measures of Association

    • One-, two-, and multiway tables
    • Row and column frequencies, percents, expected values and deviates
    • List layouts, order categories, define intervals, including missing intervals
    • 2 x 2 tables: likelihood ratio chi-square, Yates', Fisher's exact test, odds ratio, Yule's Q
    • 2 x k tables: Cochran test
    • r x r tables: McNemar's test, Cohen's kappa
    • r x c tables, unordered levels: phi, Cramer's V, contingency, Goodman-Kruskal's lambda, and uncertainty coefficients
    • r x c ordered levels: Spearman's rho, Goodman-Kruskal's gamma, Kendall's tau-b, Stuart's tau-c, Somers' D
    • Multiway tables: Mantel-Haenszel test
    • Table of counts and percents
    • Row-dependent and symmetric statistics
    • Cell statistics
    • Association measures for two-way tables along with confidence intervals; specified confidence level
    • Standardised tables (two-way tables after controlling the effect of a third variable)
    • Resampling - Bootstrap, without replacement, Jackknife

    Correspondence Analysis

    • Simple and multiple - raw data or data in tabular form
    • Quick Graphs: vector and casewise plots
    • Resampling - Bootstrap, without replacement, Jackknife

    Loglinear Models

    • Full maximum likelihood
    • Pearson and likelihood ratio chi-square
    • Expected values, lambda, SE lambda
    • Covariance matrix, correlation matrix
    • Deviates, Pearson deviates, Iikelihood deviates, Freeman-Tukey deviates, log-likelihood
    • Resampling - Bootstrap, without replacement, Jackknife
    • Dialog box with facility to type the desired model directly

    Nonparametric Tests

    • Independent samples: Kruskal-Wallis, two- sample Kolmogorov-Smirnov, Mann-Whitney
    • Related variables; sign test, Wilcoxon signed rank test, Friedman test, Quade test
    • One-sample: Wald-Wolfowitz runs test
    • One-sample: Kolmogorov-Smirnov test providing 9 discrete and 28 continuous univariate distributions, also Lilliefors test
    • One-sample: Anderson-Darling test providing 29 continuous univariate distributions
    • Resampling - Bootstrap, without replacement, Jackknife

    Multinormal Tests

    • Shapiro-Wilk (marginal) normality test
    • Multivariate skewness and kurtosis, testing for significance of these
    • Henze-Zirkler test for multivariate normality
    • Save Mahalanobis distances
    • Quick Graph: beta Q-Q plot

    Hypothesis Testing

    • Mean: One-Sample z-test, Two-sample z-test, One-Sample t-test, Two-Sample t-test, Paired t-test, Poisson test with Bonferroni, Dunn-Sidak adjustments
    • Variance: Single Variance, Equality of Two Variances, Equality of Several Variances
    • Correlation: Zero Correlation, Specific Correlation, Equality of Two Correlations
    • Proportion: Single Proportion, Equality of Two Proportions
    • Appropriate Quick Graphs
    • Resampling - Bootstrap, without replacement, Jackknife

    Correlations, Distances and Similarities

    • Continuous data: Pearson correlations, covariance, SSCP
    • Distance measures: Euclidean, city-block, Bray-Curtis, QSK
    • Rank order data: Spearman, gamma, mu2, tau-b, tau-c
    • Unordered data: phi, Cramer's V, contingency, Goodman-Kruskal's lambda, uncertainty coefficients
    • Binomial data: S2, S3, S4, S5, S6, Tetrachoric, Anderberg (S7), Yule's Q, Hamman, Dice, Sneath, Ochiai, Kulczynski, Gower2
    • Missing data: pairwise, listwise deletion, EM
    • Hadi outlier detection and estimation
    • Probabilities: Bonferroni, Dunn-Sidak
    • Quick Graph: scatterplot matrix
    • Resampling - Bootstrap, without replacement, Jackknife
    • Bootstrap estimates, bias, standard error and confidence intervals, histograms of estimates in the case of Pearson correlations and rank-ordered data

    Set and Canonical Correlation

    • Whole, semi and bi-partial set correlations
    • Rao F, R-square, shrunk R-square, T-square, shrunk T-square, P-square, shrunk P-square, within, between and inter-set correlations
    • Row/Column betas, standard errors, T-statistics and probabilities
    • Stewart-Love canonical redundancy index
    • Canonical coefficients, loadings and redundancies
    • Varimax rotation
    • Resampling - Bootstrap, without replacement, Jackknife

    Cronbach's Alpha

    • Cronbach's alpha value for tow or more variables
    • Resampling - Bootstrap, without replacement, Jackknife

    Linear Regression

    • Least-squares
      • Crossvalidation, saving residuals and diagnostics, Durbin-Watson statistic
      • Multiple linear regression
      • Prediction for new observations
      • Stepwise regression: automatic, customized and interactive stepping, partial correlations
      • AIC, AICc, BIC computation
      • Hypothesis testing, mixture models
      • Automatic outlier and influential point detection
      • Quick Graph: residuals vs. predicted values, fitted model plot in the case of one or two predictors (confidence and prediction intervals in the case of one predictor)
      • Resampling - Bootstrap, without replacement, Jackknife
      • Bootstrap estimates, bias, standard error and confidence intervals, histograms of estimates
    • Bayesian
      • Prior distribution: diffuse or (multivariate) normal-gamma distribution
      • Bayes estimates and credible intervals for regression coefficients computed
      • Parameters of the posterior distribution provided
      • Quick Graphs: plots of prior and posterior densities of regression coefficients
    • Ridge
      • Two types of ridge coefficients: standardized and unstandardized
      • Quick Graph: plot of the ridge factor against the ridge coefficients

    Robust Regression

    • Least Absolute Deviation (LAD) regression
    • M regression
    • Least Median of Squares (LMS) regression
    • Least Trimmed Squares (LTS) regression
    • Scale (S) regression
    • Rank Regression

    Logistic Regression

    • Binary, multinomial, discrete choice and conditional
    • AIC, AICc, BIC computation
    • Robust standard errors, prediction success table, derivatives table
    • Classification table with specified cutoff point
    • Dummy variables and interactions
    • Forward, backward, automatic and interactive stepwise regression
    • Deciles of risk, quantiles and simulation
    • Hypothesis tests
    • Quick Graph: ROC curve for binary logistic regression

    Probit Regression

    • Dummy variables and interactions
    • AIC, AICc, BIC computation

    Partial Least-Squares Regression

    • Useful in situations where the number of variables is large relative to the number of cases or there is likely to be multicollinearity among the predictor variables
    • NIPALS and SIMPLS algorithms
    • Crossvalidation

    Two-Stage Least-Squares

    • Model with independent and/or instrumental variables, with lags
    • Diagnostic tests for heteroskedasticity and nonlinearity
    • Polynomially distributed lags
    • Hypothesis tests

    Mixed Regression

    • Hierarchical Linear Models (HLM)
    • Specify effects as fixed or random
    • Autocorrelated error structures
    • Nested Models (2-Level): Repeated Measures, Clustered Data
    • Unbalanced or balanced data
    • Quick Graph: scatterplot, histogram or scatterplot matrix of empirical Bayes estimates

Smooth & Plot

  • 126 non-parametric smoothers including LOESS
  • Windows: fixed width or nearest neighbors
  • Kernels: uniform, Epanechnikov, biweight, triweight, tricube, Gaussian, Cauchy
  • Method: median, mean, polynomial, robust, trimmed mean
  • Save predicted values and residuals
  • Resampling - Bootstrap, without replacement, Jackknife

Nonlinear Regression

  • Gauss-Newton, Quasi Newton, Simplex
  • Output: predicted values, residuals, asymptotic standard errors and correlations, confidence curves and regions
  • Special features: Cook-Weisberg confidence intervals, Wald intervals, Marquardting
  • Robust estimation: absolute, power, trim, Huber, Hampel, t, bisquare, Ramsay, Andrews, Tukey
  • Maximum likelihood estimation
  • Piecewise regression, kinetic models, logistic model for quantal response data
  • Exact derivatives
  • Quick Graph: scatterplot with fitted curve
  • Resampling - Bootstrap, without replacement, Jackknife

ANOVA

  • Designs: unbalanced, randomised block, complete block, fractional factorial, mixed model, nested, split plot, Latin square, crossover and change over, Hotelling's T2
  • ANCOVA
  • Means model for missing cells designs
  • Repeated measures: one-way, two or more factors, three or more factors
  • Options to test normality and homoscedasticity assumptions
  • Type I , II and III sums of squares
  • Automatic outlier and influential point detection
  • AIC, AICc, BIC computation
  • Multiple comparison tests - Tukey-Kramer HSD, Bonferroni, Fisher's LSD, Scheffe, Dunnett, Sidak, Tukey's b, Duncan, R-E-G-W-Q, Hochberg GT2, Gabriel Students-Newman_Keuls, Tamhane T2, Games-Howell, Dunnett's T3
  • Confidence intervals and hypothesis tests for adjacent difference, polynomial of specified order and metric, sum, custom, Helmert, reverse Helmert, deviation and simple contrasts
  • Quick Graph: least -squares means
  • Resampling - Bootstrap, without replacement, Jackknife

MANOVA

  • Handles wide variety of designs
  • Performs repeated measures analysis
  • Means model for missing cells designs
  • Within-group and between-group testing
  • MANCOVA
  • AIC, AICc, BIC computation
  • Resampling - Bootstrap, without replacement, Jackknife

General Linear Model

  • Any general linear model Y = XB+e
  • Any general linear hypothesis ABC' = D
  • Mixed categorical and continuous variables
  • Stepwise model building
  • AIC, AICc, BIC computation
  • Post-hoc tests
  • Resampling - Bootstrap, without replacement, Jackknife
  • See also linear regression and ANOVA

Mixed Model Analysis

  • Variance components and linear mixed model structures
  • Estimates of parameters by
    • Maximum likelihood (ML)
    • Restricted maximum likelihood (REML)
    • MIVQUE(0) in the case of variance components
    • ANOVA in the case of variance components
    • Confidence intervals and hypothesis tests based on these estimates
  • Structures of covariance matrix of random effects
    • Variance components
    • Diagonal
    • Compound symmetry
    • Unstructured
  • Structures for error matrix:
    • Variance components
    • Compound symmetry
  • AIC, AICc, BIC computation

Discriminant Analysis

  • Classical Discriminant Analysis (Linear or quadratic)
    • Prior probabilities, contrasts
    • Output: F statistics, F matrix, eigenvalues, canonical correlations, canonical scores, classification matrix, Wilks' lambda, Lawley-Hotelling, Pillai and Wilks' trace, classification tables, including jackknifed, canonical variables, covariance and correlation matrix, posterior probabilities and Mahalanobis distances
    • Stepwise modeling: automatic, forward, backward and interactive stepping
    • Resampling - Bootstrap, without replacement, Jackknife
  • Robust Discriminant Analysis
    • Useful when the data sets are suspected to contain outliers
    • Linear or quadratic analysis
    • Save the robust Mahalanobis distance, weights, and predicted group membership

Cluster Analysis

  • Hierarchical
    • Distance measures: Euclidean, percent, gamma, Pearson, R-squared, Minkowski, chi-square, phi-square, absolute, Anderberg, Jaccard, Mahalanobis, RT, Russel, SS
    • Additional options to specify the covariance matrix for computing the Mahalanobis distance
    • Linkage methods: single, complete, centroid, average, median, Ward, flexible beta, k-neighborhood, uniform, weighted
    • Cutting cluster tree based on specified nodes and tree height
    • Five indices for cluster validity: RMSTTD, Dunn, Davies-Bouldin, Pseudo F, Pseudo T2
    • Quick Graphs: dendrogram, matrix and polar
    • Resampling - Bootstrap, without replacement, Jackknife
  • K-means and K-medians
    • Distance measures: Euclidean, MWSS, gamma, Pearson, R-squared, Minkowski, chi-square, phi-square, absolute, Mahalanobis
    • Additional options to specify the covariance matrix for computing the Mahalanobis distance
    • Initial seeds can be specified from: None, first, last or random k, random or hierarchical segmentation, principal component, partition variable, from file
    • Quick Graphs: parallel coordinate and mean/std deviation profile plots
  • Additive trees
    • Input: similarity, dissimilarity matrices
    • Quick Graph: dendrogram

Factor Analysis

  • Principal components, iterated principal axis, maximum likelihood
  • Rotation: varimax, quartimax, equimax, orthomax, oblimin
  • Resampling - Bootstrap, without replacement, Jackknife

Time Series

  • Smoothing: LOWESS, moving average, running median, and exponential
  • Seasonal adjustment
  • Fourier and inverse Fourier transforms
  • Box-Jenkins ARIMA model
  • Specify autoregressive, difference and moving average parameters
  • Forecast and standard errors
  • Polynomially distributed lags
  • Trend Analysis: Mann-Kendall test for nonseasonal data, and seasonal Kendall and Homogeneity tests with Sen slope estimator
  • Quick Graphs: series plot, autocorrelation, partial autocorrelation, cross correlation, periodogram

Missing Value Analysis

  • EM Algorithm
  • Regression imputation
  • Save estimates, correlation, covariance, SSCP matrices
  • Resampling - Bootstrap, without replacement, Jackknife

Quality Analysis

  • Histogram, Pareto Chart, Box-and-Whisker Plot
  • Control Charts: Run Chart, Shewhart Control Chart, Average Run Length, Operating Characteristic Curve, Cumulative Sum Chart, Moving Average, Expected Weighted Moving Average, X-MR Chart, Regression Chart, TSQ
  • Process Capability Analysis

Survival Analysis

  • Nonparametric: Kaplan-Meier, Nelson-Aalen and actuarial life tables with confidence intervals
  • Turnbull KM estimation (EM)
  • Cumulative hazards and log cumulative hazards
  • Cox regression, parametric models: exponential, accelerated exponential, Weibull, accelerated Weibull, lognormal, log-logistic
  • Type I, II and III censoring
  • Stratification, time dependent covariates
  • Forward, backward, automatic and interactive stepwise regression
  • AIC, AICc, BIC computation
  • Quick Graphs: survival function, quantile, reliability and hazard plots, Cox-Snell residual plot

Response Surface Methods

  • Fits a second degree polynomial to one or more responses on several factors
  • Output: regression coefficients, analysis of variance, tests of significance
  • Optimum factor settings using canonical (for each response) or desirability (for all responses jointly) analysis,
  • Quick Graphs: Desirability plots
  • Contour and surface plots with fixed settings for one or more factors

Path Analysis (RAMONA)

  • Analyze covariance or correlation matrices
  • MWL (maximum Wishart likelihood)
  • GLS (generalized least-squares)
  • OLS (ordinary least-squares)
  • ADFG (asymptotically distribution free estimate biased, Gramian)
  • ADFU (unbiased)

Conjoint Analysis

  • Monotonic, linear, log and power
  • Stress and tau loss functions
  • Quick Graph: utility function plot
  • Resampling - Bootstrap, without replacement, Jackknife

Multidimensional Scaling

  • Two-way scaling: Kruskal, Guttman, Young
  • Three-way scaling: INDSCAL
  • Non-metric unfolding
  • EM estimation
  • Power scaling for ratio data
  • Quick Graphs: MDS plot, Shepard diagram

Perceptual Mapping

  • MDPREF
  • Preference mapping (vector, circle, ellipse)
  • Procrustes and canonical rotations
  • Quick Graph: biplots

Partially Ordered Scalogram Analysis with Coordinates (POSAC)

  • Guttman-Shye algorithm; automatic serialisation
  • Quick Graph: item plot
  • Resampling - Bootstrap, without replacement, Jackknife

Test Item Analysis

  • Classical analysis
  • One- and two-parameter logistic model
  • Quick Graph: item plot

Signal Detection Analysis

  • Models: normal, Chi-square, exponential
  • Quick Graph: receiver operating characteristic curve

Spatial Statistics

  • 2D & 3D variogram, Kriging and simulation
  • Variogram types: semi, covariance, correlogram, general relative, pairwise relative, semi-log, semimadogram
  • Semivariogram models: spherical, exponential, gaussian, power and hole effect
  • Kriging types: simple, ordinary, nonstationary and drift
  • Quick Graphs: variogram and contour plot
  • Resampling - Bootstrap, without replacement, Jackknife

Classification and Regression Trees

  • Loss functions: least-squares, trimmed mean, LAD, phi coefficient, Gini index, twoing
  • Quick Graph: unique tree mobile including split statistics and color coded subgroup densities (box, dot, dit, jitter, stripe)
  • Resampling - Bootstrap, without replacement, Jackknife

Monte Carlo

  • Mersenne-Twister random number generator
  • Multivariate random sampling: multinomial, bivariate exponential, Dirichlet, multivariate normal, and Wishart distributions
  • IID Monte Carlo: Two generic algorithms - rejection sampling and adaptive rejection sampling (ARS)
  • Markov Chain Monte Carlo (MCMC): Metropolis-Hastings (M-H) and Gibbs sampling algorithms
  • Monte Carlo integration

Quality Analysis

  • Gauge R & R studies
  • Sigma measurements
  • Taguchi's loss function
  • Taguchi's online control - beta correction, taguchi's loss/savings