Skip to main content Skip to search Skip to main navigation
Menu

nQuery

nQuery + nTerim is a mighty program for power analysis and determining required sample sizes.
Description

Product information "nQuery"

Why Choose nQuery?

📏 Optimal Sample Size – Avoid underpowered or oversized studies
💰 Cost Reduction – Save significantly on clinical trials through precise planning
📈 Greater Efficiency – Enhance the statistical power and relevance of your results
🧠 370+ Procedures – Covers a wide range of study designs and statistical tests
⚕️ Trusted in Clinical Practice – Used globally by pharma, biotech & medical research institutions


🧬 Typical Use Cases

✔️ Clinical trials (Phases I–IV)
✔️ Medical research & epidemiology
✔️ Biostatistics & public health
✔️ Pharmaceutical development
✔️ Biotechnology & regulatory trial design


🛠️ Key Features at a Glance

🔹 Calculate sample size for a wide variety of statistical tests and study designs
🔹 Perform power analysis for fixed sample sizes
🔹 Plan studies including parallel groups, crossover designs, survival analysis, non-inferiority trials, and more
🔹 Supports both classical and modern methodologies
🔹 User-friendly interface with comprehensive documentation and guidance


📌 Conclusion: nQuery – Plan with Confidence. Research with Efficiency.

nQuery ensures your clinical study is neither underpowered nor over-resourced. That means more reliable results, better decision-making, and optimized resource use. Get your study design right from the start—with nQuery.

📥 Discover nQuery & request your free demo today!
➡ Contact us for pricing, consultation, or a personalized trial.


Details

📊 nQuery® – Software for Sample Size Calculation & Power Analysis

nQuery is the world's leading software for determining optimal sample sizes and conducting accurate power analyses. Designed specifically for precise study planning in clinical research, biostatistics, and medical studies, nQuery helps reduce costs, ensure statistical power, and optimize trial design.


Why nQuery?

📈 Optimal sample size – Avoid under- or overpowered studies
💡 Intuitive interface with built-in guidance and explanations
🧪 370+ statistical procedures and test scenarios
💰 Reduce trial costs through targeted power analyses
🧠 Ideal for biostatisticians, clinical trial planners, and research professionals in pharma, healthcare, and biotech
🧰 Supports a wide range of models – from t-tests to Cox regression


🔬 Calculation Capabilities in nQuery

Means & Group Comparisons:

✔️ Paired samples
✔️ Two- and multi-sample comparisons
✔️ Repeated measures
✔️ Crossover designs
✔️ Equivalence & non-inferiority studies
✔️ Mann-Whitney U test

Regression Models:

✔️ Linear, multiple, and logistic regression
✔️ Cox regression, Poisson regression, Probit regression

Survival Analysis & Frequency Tests:

✔️ Two-group survival comparisons
✔️ Frequency comparisons (e.g., contingency tables)
✔️ Confidence intervals for means and proportions


🔄 Advanced Tools & Assistants

🧩 Suites: Regression Suite, Means Suite, Poisson & Incidence Rates
👥 Cluster-randomized trials (CRT): Means, proportions, superiority, non-inferiority & equivalence
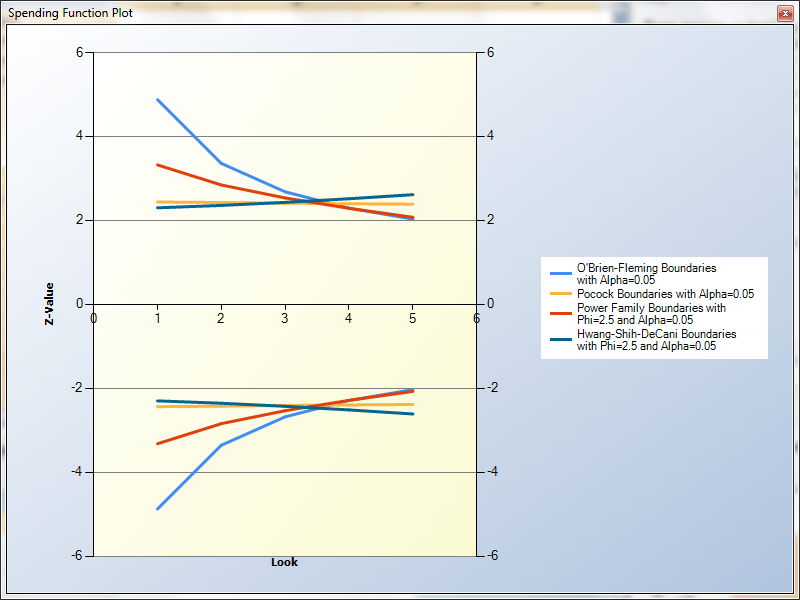
📊 Power vs. Sample Size plots – Visualize “what-if” scenarios instantly
🔄 GST Sequential Trial Assistants – Account for alternative rates in survival analysis


🌐 Premium Maintenance (Optional)

✔️ Access to all major version upgrades & ongoing updates
✔️ Technical support & installation assistance
✔️ Fast online help via ticket system or live chat
✔️ Personal account with secure online access to updates & resources


💬 Conclusion: nQuery – Precision, Efficiency & Confidence in Clinical Study Planning

nQuery is the essential tool for anyone planning clinical trials with precision and confidence. Whether you're meeting regulatory standards or driving internal research quality, nQuery helps you reduce costs, increase statistical validity, and ensure your study is designed right the first time.

📥 Request a demo and discover more today:
Visit the official site – www.statsols.com/nquery

Requirements

Systemvoraussetzungen für die Software nQuery:

MINIMUM (known) system requirements for nQuery Advanced.

  • 2 core processor of 1 GHz 'speed'
  • 3 GB of available hard disk space
  • 2GB RAM
  • Windows 10, then it must be higher than version 1511.
    -Please note that Windows 10 S is not supported.
  • .NET Framework 4.7.1

Note: Administrative privileges to the end users machine will be required for installation process only.

Skip product gallery

Recommended

PASS
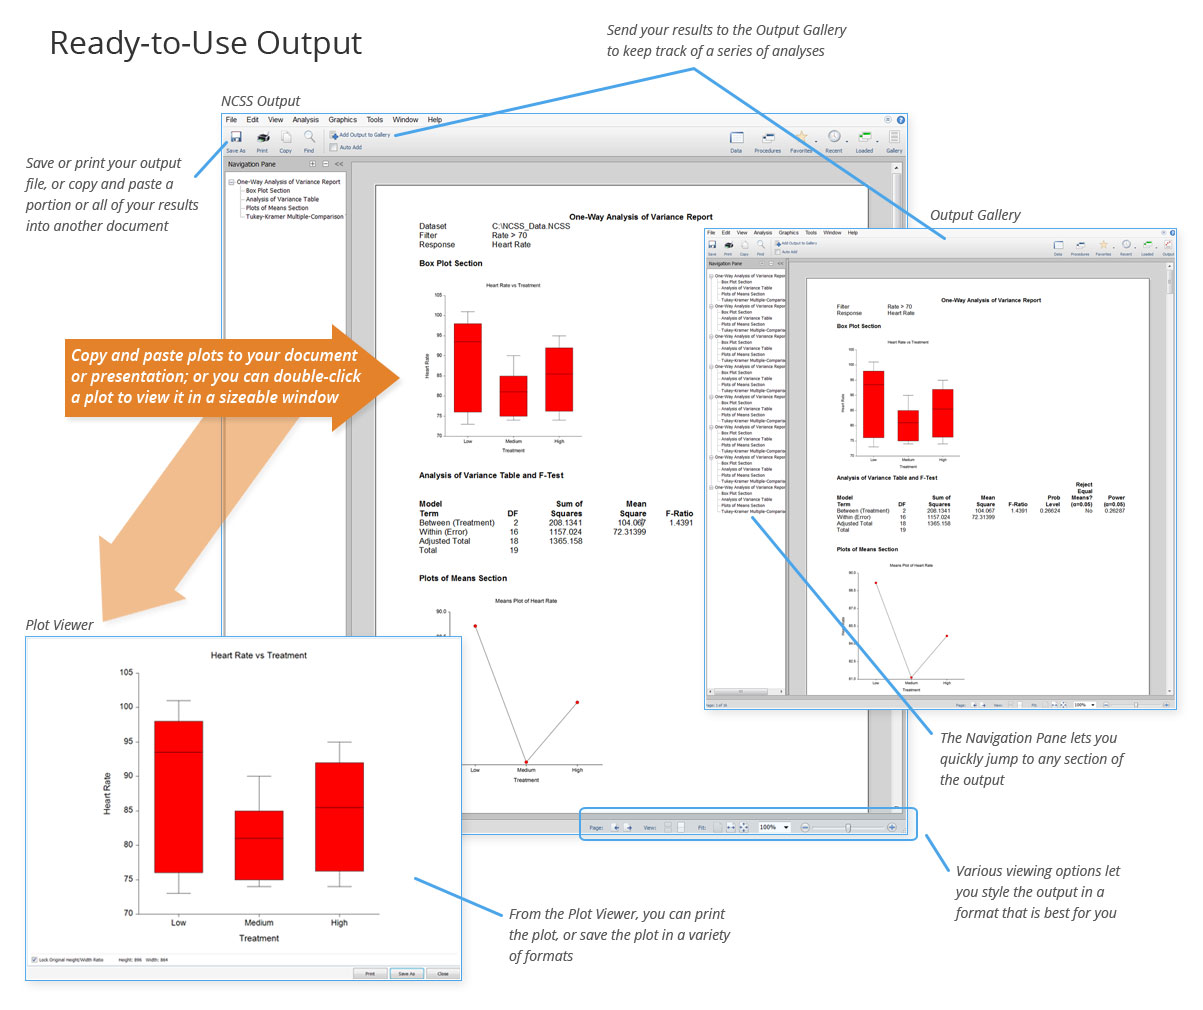
🧪 PASS® – Professional Software for Sample Size Calculation & Power Analysis PASS is one of the leading solutions for sample size determination, power analysis, and statistical precision planning—essential for clinical trials, medical research, and pharmaceutical development projects. With over 680 validated procedures and 230+ study designs, PASS offers unmatched methodological flexibility in a highly intuitive interface. ✅ Why Choose PASS? 📊 680+ validated procedures for power and sample size analysis 🔬 230+ study design templates for maximum methodological versatility 🖥️ Intuitive workflow – Get results in just 3 steps: choose a design, enter parameters, interpret output 📈 Built-in visualizations – Clean, exportable graphs and plots for every analysis 📄 Compatible with Word, Excel, and more – Export results directly into reports and presentations 🧠 Easy to learn, fast to apply – Ideal for researchers, statisticians, and trial planners 🔍 Typical Applications ✔️ Clinical trial planning (Phase I–IV) ✔️ Pharmacological & epidemiological studies ✔️ Biostatistics & health sciences ✔️ Medical devices & public health research ✔️ Academic & regulatory study planning 🧩 Key Features at a Glance 🔹 Optimal sample size calculation 🔹 Perform power analysis for a wide range of statistical tests 🔹 Analyze statistical test sensitivity and power 🔹 Supports designs including: parallel groups, crossover, survival analysis, non-inferiority, and more 🔹 Confidence interval planning & effect size estimation 🔹 Support for one- and two-sided hypothesis testing 🔹 Clear output with inline help, definitions, and guidance 🔹 Expandable report builder with notes, custom text & selected output exports 🛠️ Examples of Included Tests 📍 t-tests (one-sample, two-sample, paired) 📍 ANOVA & ANCOVA 📍 Chi-square tests 📍 Logistic regression 📍 Cox regression 📍 Survival analysis 📍 Poisson models 📍 Non-inferiority & equivalence tests 📍 Confidence interval planning for means, proportions, and more 💬 Conclusion: PASS – Your Trusted Partner for Precise Study Design With PASS, you can avoid under- or overpowered studies, save time and resources, and ensure the statistical integrity of your research. Whether you're working in clinical trials, pharma, or public health, PASS provides the ideal combination of scientific depth and ease of use. 📥 Try PASS or request a consultation today: ➡ Learn more at the official PASS website: www.ncss.com/software/pass

Price on request
NCSS
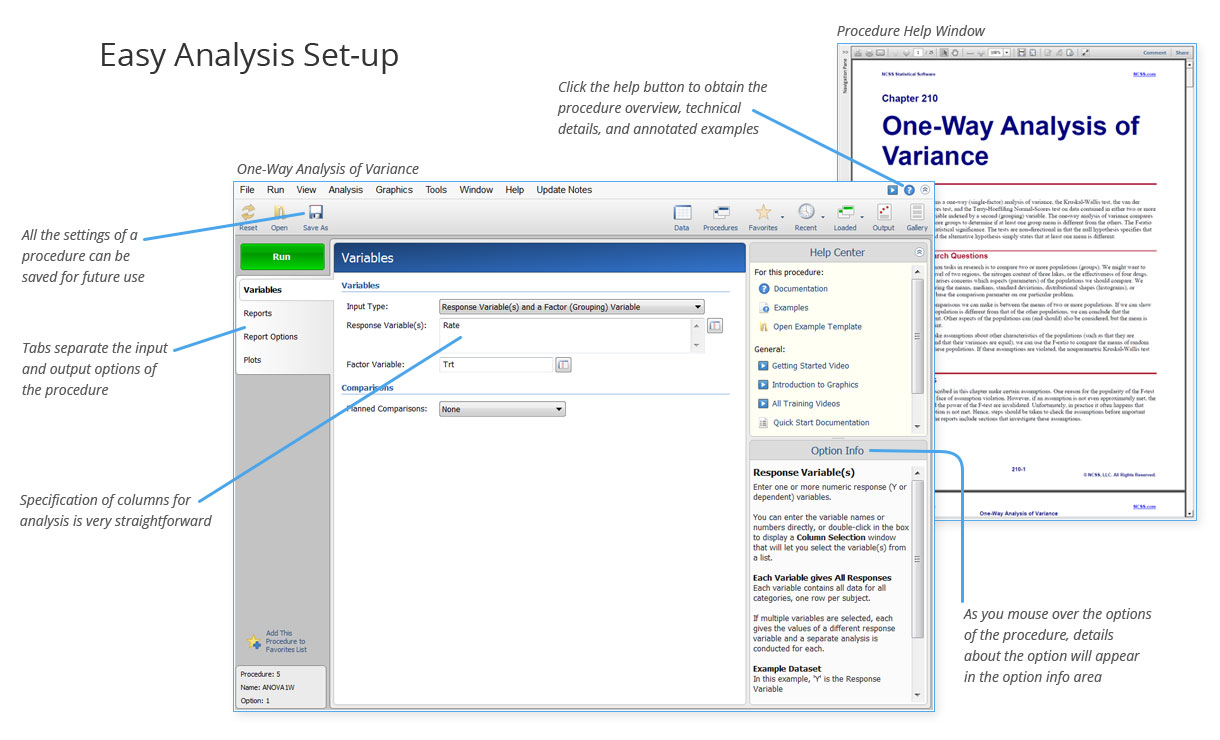
📊 NCSS – Your Powerful Statistical Software for Comprehensive Data Analysis 🚀 NCSS: The All-in-One Statistics Package for Your Data Analytics Needs NCSS is a versatile statistical software solution that provides powerful tools for data analysis, forecasting, and statistical modeling. Whether you need descriptive statistics, regression analysis, Design of Experiments (DoE), or Statistical Process Control (SPC) – NCSS offers all the features you need for confident, data-driven decisions. 🌟 Why Choose NCSS? ✅ Comprehensive statistics suite – From basic descriptive methods to advanced modeling ✅ Intuitive menu navigation – Quickly find the right tool for your analysis ✅ High-quality data visualization – Clear, informative graphics for accurate interpretation ✅ Extensive documentation & learning resources – In-depth manuals and training videos included 🔍 Powerful Features for Your Analysis 📈 Data Analysis & Core Statistical Tools ✔ Descriptive statistics & mean comparisons for thorough data evaluation ✔ Regression analysis – from linear to generalized linear models (GLM) for precise prediction ✔ Time series analysis & ARIMA models – forecast trends based on historical data 🔬 Advanced Methods ✔ Design of Experiments (DoE) – Optimize products and processes ✔ Cluster analysis – Discover hidden patterns and groupings in complex datasets ✔ Survival analysis (Kaplan-Meier) – Reliability and risk assessment made easy 📊 Data Visualization & Reporting ✔ Dynamic charts and graphs to enhance your insights ✔ Automated reporting tools for professional, publication-ready results 🎯 NCSS – The Right Choice for Experts & Beginners Alike Whether you're a scientist, data analyst, or quality control specialist, NCSS delivers the statistical power and flexibility to tackle any challenge—no programming required. 📢 Discover NCSS now and take your data analysis to the next level! ➡ Learn more and start your free trial

Price on request
GraphPad Prism
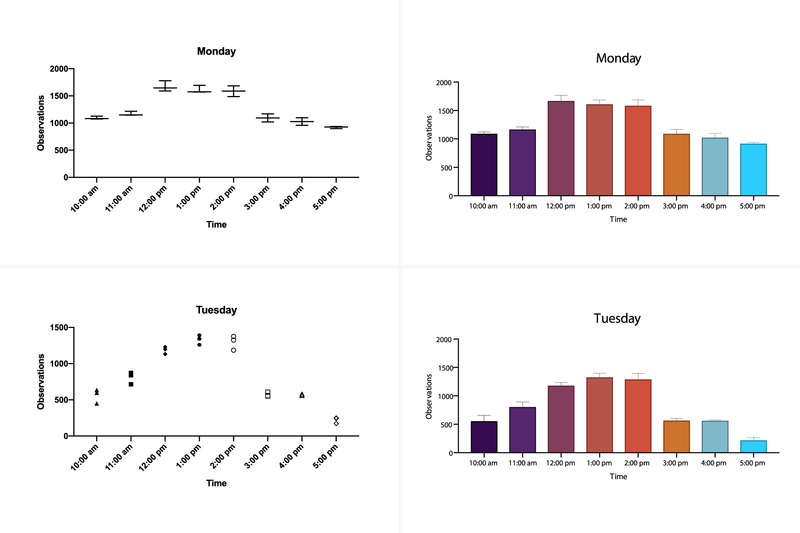
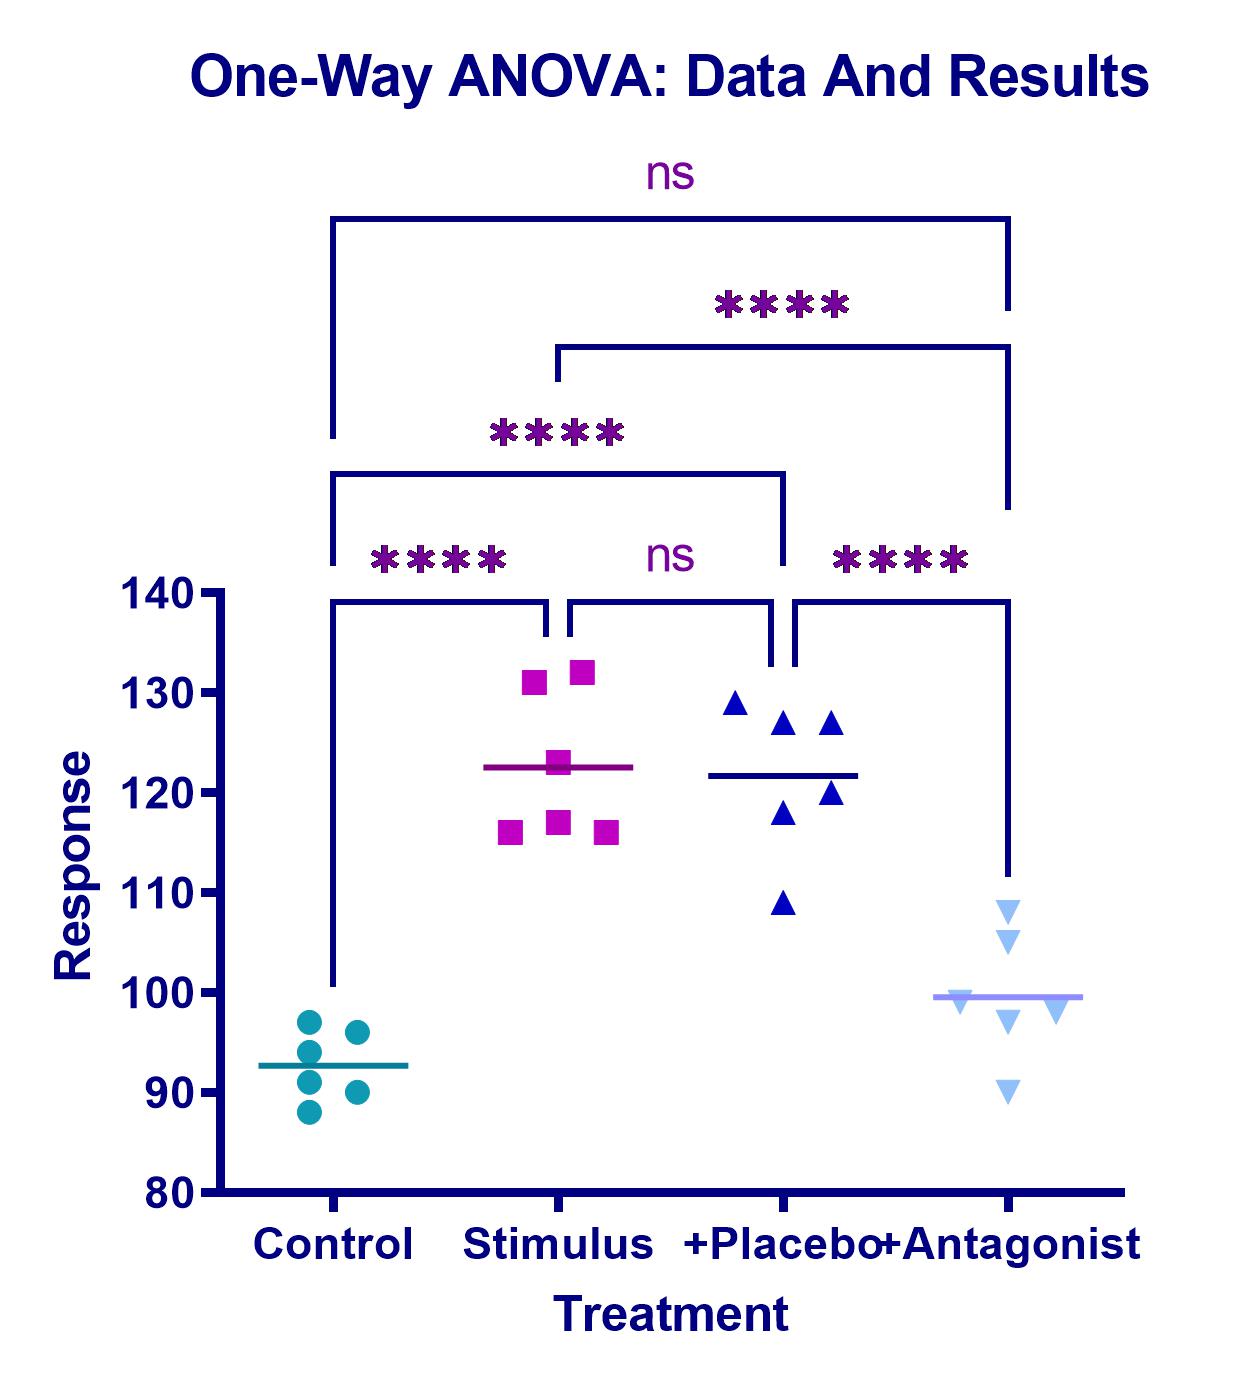
GraphPad Prism – The Leading Software for Data Analysis & Scientific Visualization GraphPad Prism is the preferred statistics and graphing software designed specifically for scientific research. Researchers around the world use Prism to perform accurate data analysis, make informed statistical decisions, and present results in professional, publication-ready charts. 🚀 Save time and improve the accuracy of your analyses with GraphPad Prism! Biostatistics & Data Analysis for Life Sciences Originally developed for biology, medicine, and pharmacology, GraphPad Prism is now widely used across the life sciences—from students and PhD researchers to scientists in the pharmaceutical and healthcare industries. ✅ Easy-to-use statistical analysis tools for scientists ✅ Automated graphing for accurate data visualization ✅ Clear, easy-to-understand results interpretation 📌 No other software offers such intuitive and powerful curve fitting! Powerful Statistical Tools in GraphPad Prism GraphPad Prism includes a wide range of statistical tests and regression models to help you analyze your research data precisely and confidently. Included Statistical Methods: 📊 t-tests (unpaired & paired) 📊 ANOVA (one-way, two-way, three-way) 📊 Nonparametric tests 📊 Linear & nonlinear regression 📊 Survival analysis (Kaplan-Meier) 📊 Contingency table analysis 💡 Especially for nonlinear regression, Prism offers advanced tools to calculate EC50, fit complex models, and compare curves with ease. Scientific Graphing with Flexible Chart Customization With GraphPad Prism, you can create high-quality scientific graphs that update automatically when your data changes. 🎨 Graphing Highlights: ✅ Automatically generated graphs based on your analyses ✅ Fully customizable axes, colors, labels, and layouts ✅ One-click templates for professional, consistent output 📈 Create perfect scientific visuals in just a few clicks! Why Choose GraphPad Prism? 🔹 Fast & easy data analysis for scientists 🔹 Automated statistics and charting for accurate research 🔹 Comprehensive tools for biostatistics & nonlinear regression 🔹 Intuitive interface – perfect for students and professionals alike 🚀 Get started with GraphPad Prism and take your scientific research to the next level! 📥 Download your free trial now: ➡ Learn more & get the free trial

Price on request
GraphPad Prism - Introduction
Course: Introduction to GraphPad Prism – Fundamentals of Data Analysis for Beginners In this two-day training, you will gain a solid foundation for working with GraphPad Prism, one of the leading tools for data analysis and visualization in biomedical research. You will learn the complete process of data analysis, from data acquisition to result interpretation. This course is ideal for beginners with no experience in PRISM, as well as for advanced users who want to refresh their knowledge. After the course, you will be able to use the PRISM environment confidently and conduct data analyses independently. You will be able to identify and interpret key metrics of the analysis. Course content: Day 1: Basics of GraphPad Prism 📊 PRISM Interface and Project Types 📊 Data Handling in PRISM: Formats, data entry, and import 📊 Descriptive Statistics: Tables and basic analysis 📊 Creating and Designing Graphs: Different types of charts such as bar charts, scatter plots, box plots, and Kaplan-Meier plots 📊 Graphs for Paired Samples (Before-After, Repeated Measures Graphs) 📊 Visualizing Variability in Graphs: Error bars, standard deviation (SD), confidence intervals (CI) 📊 Exporting Results: Exporting graphs and layouts to PowerPoint and Word Day 2: Statistical Analysis with GraphPad Prism 📊 Mean Comparisons: Performing t-tests, one-way ANOVA, and non-parametric tests 📊 Post-Tests: Selection and execution 📊 XY Projects: Creating dose-response curves, performing regressions, and interpreting the results 📊 Using Post-Tests and Statistical Tools in GraphPad Prism Requirements: No prior knowledge required – the course is ideal for beginners and anyone who needs a refresher. 🕒 Course Duration: 2 days 🔹 Sign up now and improve your analysis skills with GraphPad Prism!

Price on request