New features of SOSstat:
OSstat 3 features
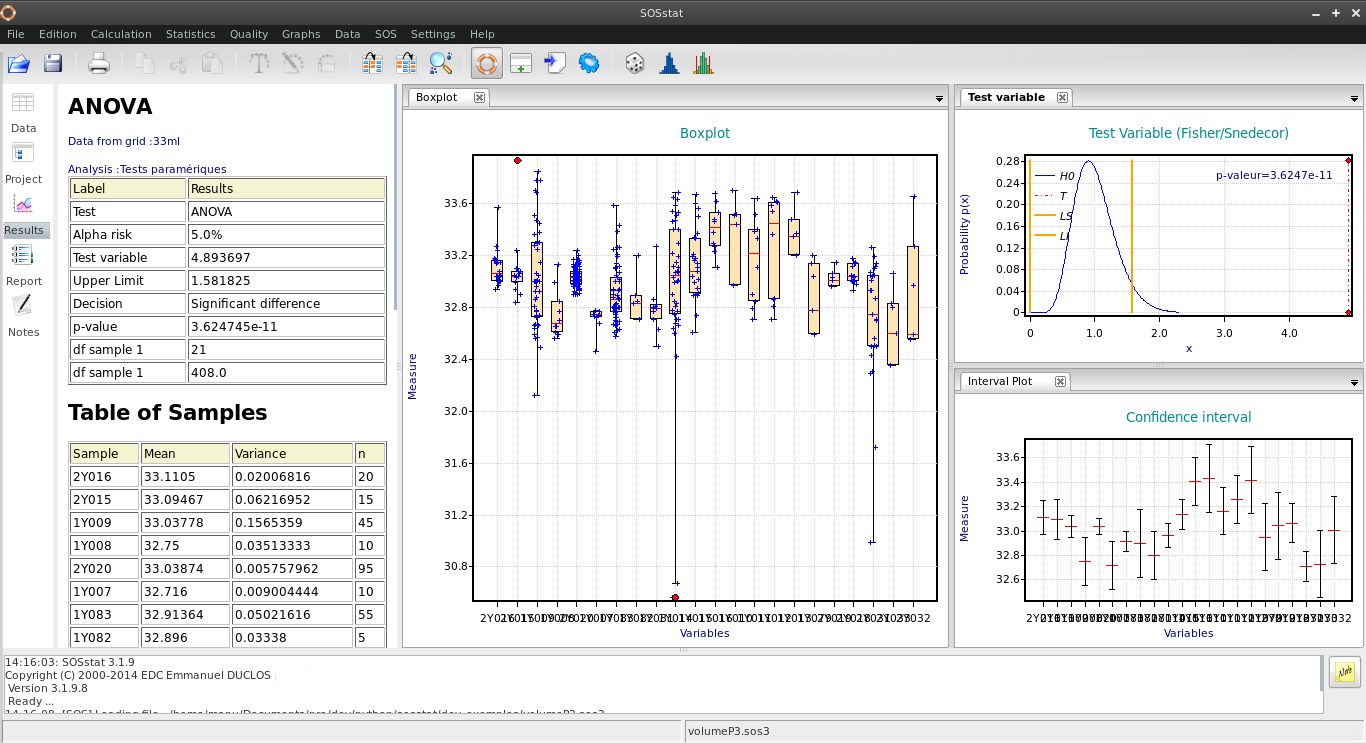
SOSstat is rich and versatile software. It brings together a large number of statistical and engineering techniques in a simple and powerful environment. The graphical interface is organized in three distinct parts:
- A spreadsheet to store, modify and reorganize data. The spreadsheet can import an excel workbook with all its grids.
- A window dedicated to the display of numerical and graphical results. Graphs are resizable, reorganizable and exportable.
- A report that can be exported to a word processor, where the user can compile the results, either step by step or by automating the processing.
One of the strengths of SOSstat is to provide comments for each analysis, in order to facilitate the interpretation of the results.
SOSstat - Statistics
SOSstat 3 ® contains a large number of statistical procedures for testing and exploratory statistics.
Descriptive statistics
- Histogram
- Boxplot
- Correlation matrix
- Population parameters
- Statistical summary function
- Density estimation
- Read more …
Normality tests
- Kolmogorov test
- Anderson Darling test
- Shapiro-Wilk test
- Probability plot
- Read more …
Regression
- Simple regression with different models:
- Linear with variable transformation
- Quadratic
- Confidence interval and prediction interval
- Applied test on a theoretical model
- Robust regression
- Orthogonal regression
- Read more …
- Multiple regression
- Calculation of residuals, Studentized and standardized residuals
- Cook’s distances and leverage calculation
- Standardization of predictors for analyzing designs experiments
- Prediction tool for the search for an optimum
- Read more …
Parametric tests
Tests applicable when populations is normally distributed
- All the tests that follow can be selected using a wizard that directs the user to the test most suited to his problem.
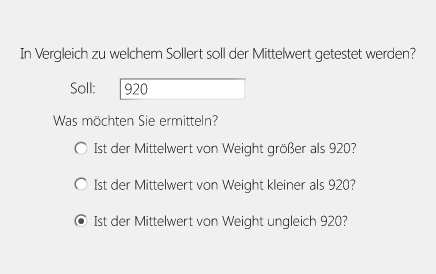
- Compare the average or the variance to a theoretical value
- Comparison of two samples: Student test, Welch test, Fisher test, average test for paired samples
- Comparison of n samples : Bartlett’s test, analysis of variance (ANOVA)
- Read more …
Nonparametric Tests
Tests applicable when populations do not follow normal distribution
- Centering a sample with a reference value: Sign test, wilcoxon rank signed test
- Centering two samples: Wilcoxon Mann Whitney Test
- Centering test for two paired samples: Sign test
- Dispersion test for two samples: Ansari-Bradley test
- Centering test for n samples : Kruskal-Wallis Test
- Dispersion test for n samples : Levene test
- Comparison of two distributions : Kolmogorov 2 samples test
- Read more …
Proportion tests
- Comparison of proportion to a theoretical value (exact and asymptotic test)
- Comparison of a frequency to a theoretical value (Poisson distribution)
- Comparison of two proportions (Fisher’s exact test), and asymptotic test (Normal distribution)
- Comparison of frequencies (Poisson distribution)
- Comparison of n proportions
Equivalence tests
These tests are particularly interesting to demonstrate that experimental results are “equivalent”, i.e. the difference between experimental results cannot exceed a specified value. These tests are notably used to carry out bio-equivalence.
- Equivalence of averages (several variants of this test)
- Population equivalence (several variants of this test)
- Read more …
Detecting outliers
Detection of atypical values likely to pollute experimental results.
- Grubbs test - outlier detection in one sample
- Cochran test - outlier detection in several samples
- Graphical test in Boxplot
Statistical intervals
- Tolerance interval
- Prediction interval of a mean
- Prediction interval of individual values
Multivariate analysis
- Principal component analysis
SOSstat3 - Quality
SOSstat3 provides a toolbox to improve product quality and control processes.
Statistical process control SPC
- Measurement control charts (
, /S
- , Moving Average, Individual Values, Small batches) with logbook
- EWMA Control chart
- Control charts for attributes: p, np, c and u
- Measurement sampling plan (S method)
- Process capability ans performance study (AFNOR, QS9000, 6 Sigma)
- Capability study for non-normal process: normal folded distribtion , position errors distribution, log-normal, stratified populations
- Inertial capability study
- Assessment of capabilities for a range of characteritics
- Wizard for calculating limites of control charts for measurement
- Wizard for calculating sample sizes
- Plot operating characteristic curves of an average control chart
- Wizard for calculation of capability threshold
- Validation of tools and machines
- Read more …
Reliability
- Modeling laws failure distribution with Weibull or exponential distribution
- Management truncated, censored and suspended trials
- Success test to validate a reliability level
Metrology
- Measurement capability analysis (Charbonneau, GRR method X-bar /R and R)
- Measurement capability study with Crossed ANOVA et nested ANOVA
- Type 1 Measurement capability (Cg - Cgk)
- Tests of bias and linearity for measurement systems
- Attributive capability studies : probabilistic method, signal method or analytical method
- Linearity study of measurement
Designs of experiment (DOE)
Design of experiments and analysis of results
- Orthogonal designs : Full factorial design, fractional factorial design
- Design of two-level fractional designs according to the Taguchi method
- Surface Design : Centered Composite, Box Behnken
- Plackett and Burman designs
- D-optimal design
- Desirability function to optimize multiple responses
- Calculation of signal / noise ratios for product plans (Robustness)
- Read more …
Quality Assistants
- Design and Evaluation of Sampling Plans for Attributes and Measures
- Design of sampling plans with Limiting Quality
- Calculation of control charts limits
- Evaluating the effectiveness of average control charts
- Calculating the optimal sample size for a control chart
- Calculation of the Z indicator of the 6-Sigma projects
- Calculation of capacity thresholds for risk control
- Bidirectional relationship between capability indicators and non-conforming rates
- Design of a reliability run test
Standard Used : AIAG MSA, AIAG SPC, ISO 11462-1, NFX06031-1:4, NFX06034, ISO_2021247, ISO 21747, ISO_7870, ISOTR22514-4, ISOTR7871
SOSstat 3 - Graphics
SOSstat ® Offers a wide range of graphical representations :
- Boxplot
- Histogram
- Run chart
- Cumulative distribution function
- Multivari plot
- Synthesis (or summary) graphs - Pareto, Bar Graph on sample parameters
- 2D graphs - Time Series - Scatter (linear scale / log scale)
- 3D Graphs - Scatter, Contours, Surface
- Bubble plot
- Graphs for contingency tables - Radar graphs, Bar Graph
Import/export
- Import text files, CSV
- Import / Export excel files
- Import data from a database - SQL Queries
- Instrument Connectivity USB port or RS232 port, Automation of analysis
- Record data in XML format, to ensure data survivability
- Encrypted file protection for email exchanges
- Export reports in RTF, WORD, HTML format

