Analyse-it prices starting from 386.75 €
0


Total
incl. 19 % VAT

Analyse-It is fully integrated into Excel, it offers a wide range of statistical methods and scientific graphtypes. The combination of Excel and Analyse-it does not fall short in comparison to mature statistical packages in terms of functionality and features. Analyse-it does not use the built-in statistical functions of Excel. All statistical functions are carefully re-coded.

Analyse-it comes with a document on software validation. This allows you to confirm whether an analytical method is suitable for the intended use.

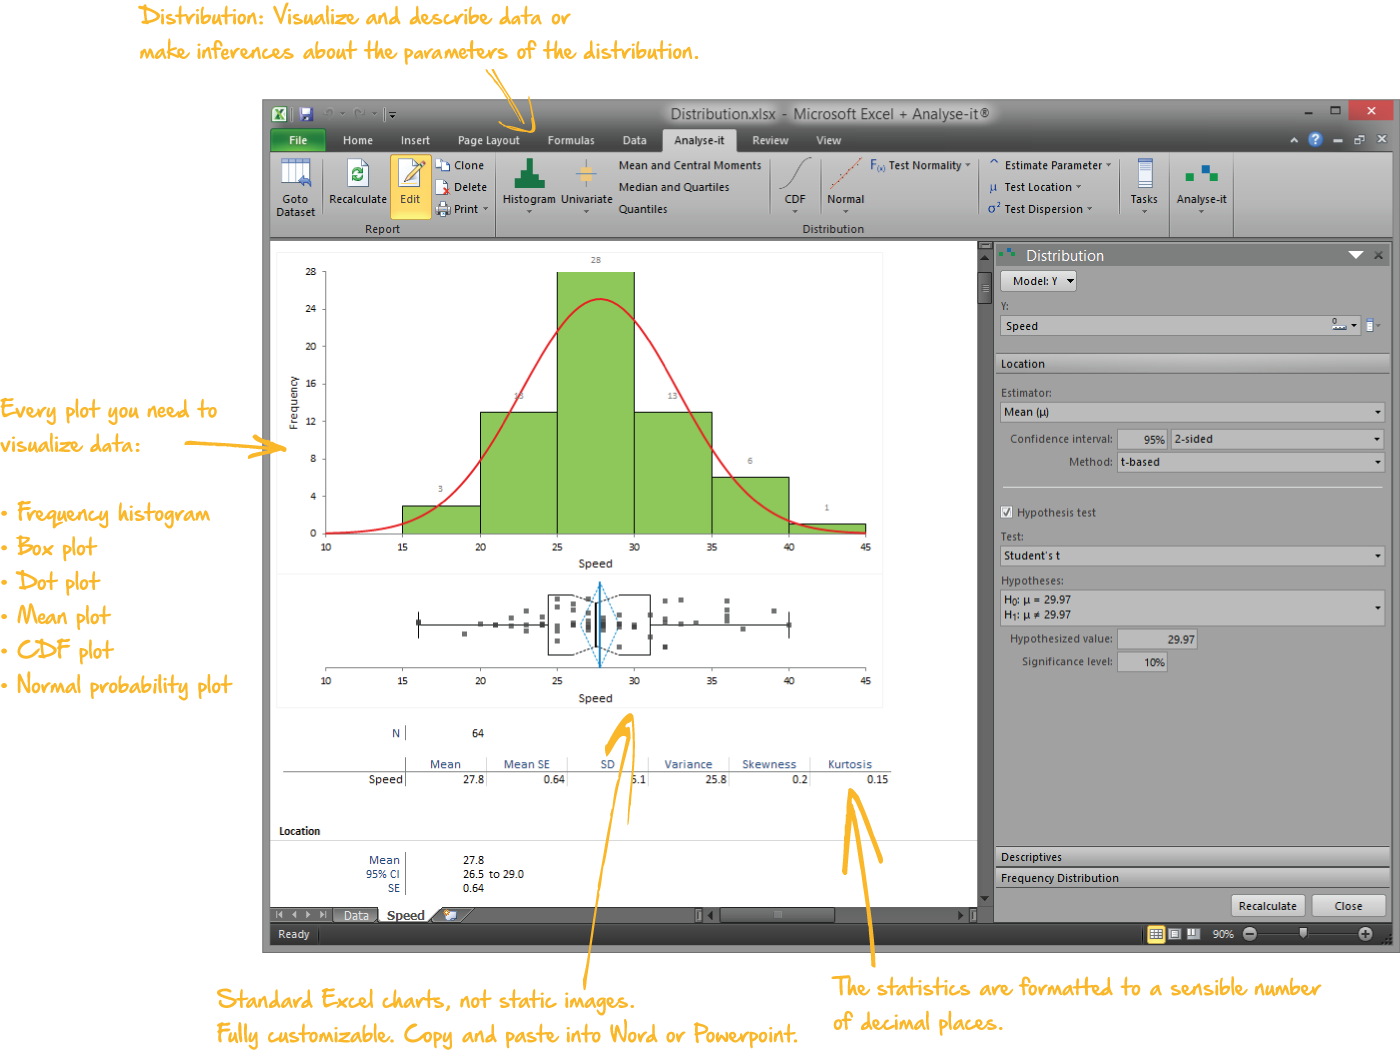
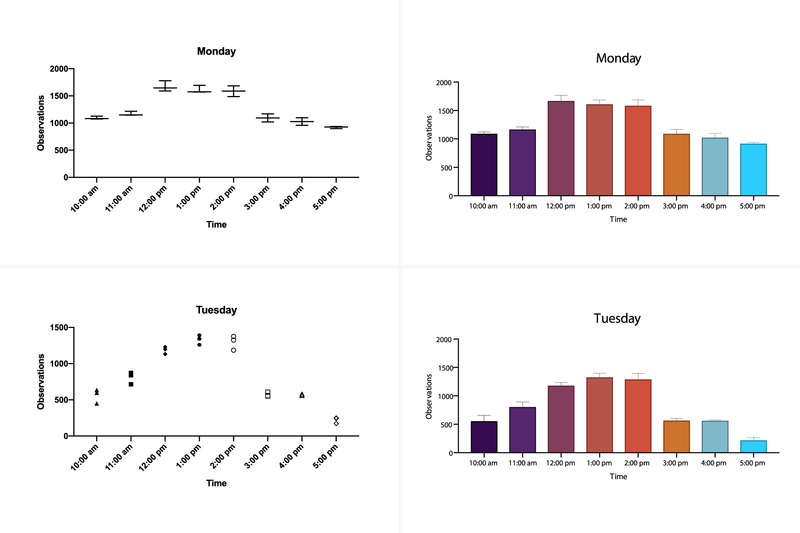
Analyse-it offers a variety of parametric and non-parametric tests and an extensive collection of statistical methods such as correlation, multiple linear regression, analysis of variance and chi-square statistics. It also includes a comfortable routine to create Box and whisker plots.

The Analyse-it Method Evaluation module comes with special procedures for clinical research and includes all the features of the Analyse-it Standard Edition.

Arguments for Analyse-it:

  • Easily integrates into Excel
  • Offers a variety of parametric and non-parametric tests
  • Especially suitable for clinical trials

Recommended products

WinSTAT

WinSTAT

WinSTAT

WinSTAT is an Excel Add-On for statistical data analysis. It’s easy to use, powerful and cheap! more details

Download pricelist Product information

Analyse-it - The most popular statistical software add-in for Microsoft® Excel® for Windows

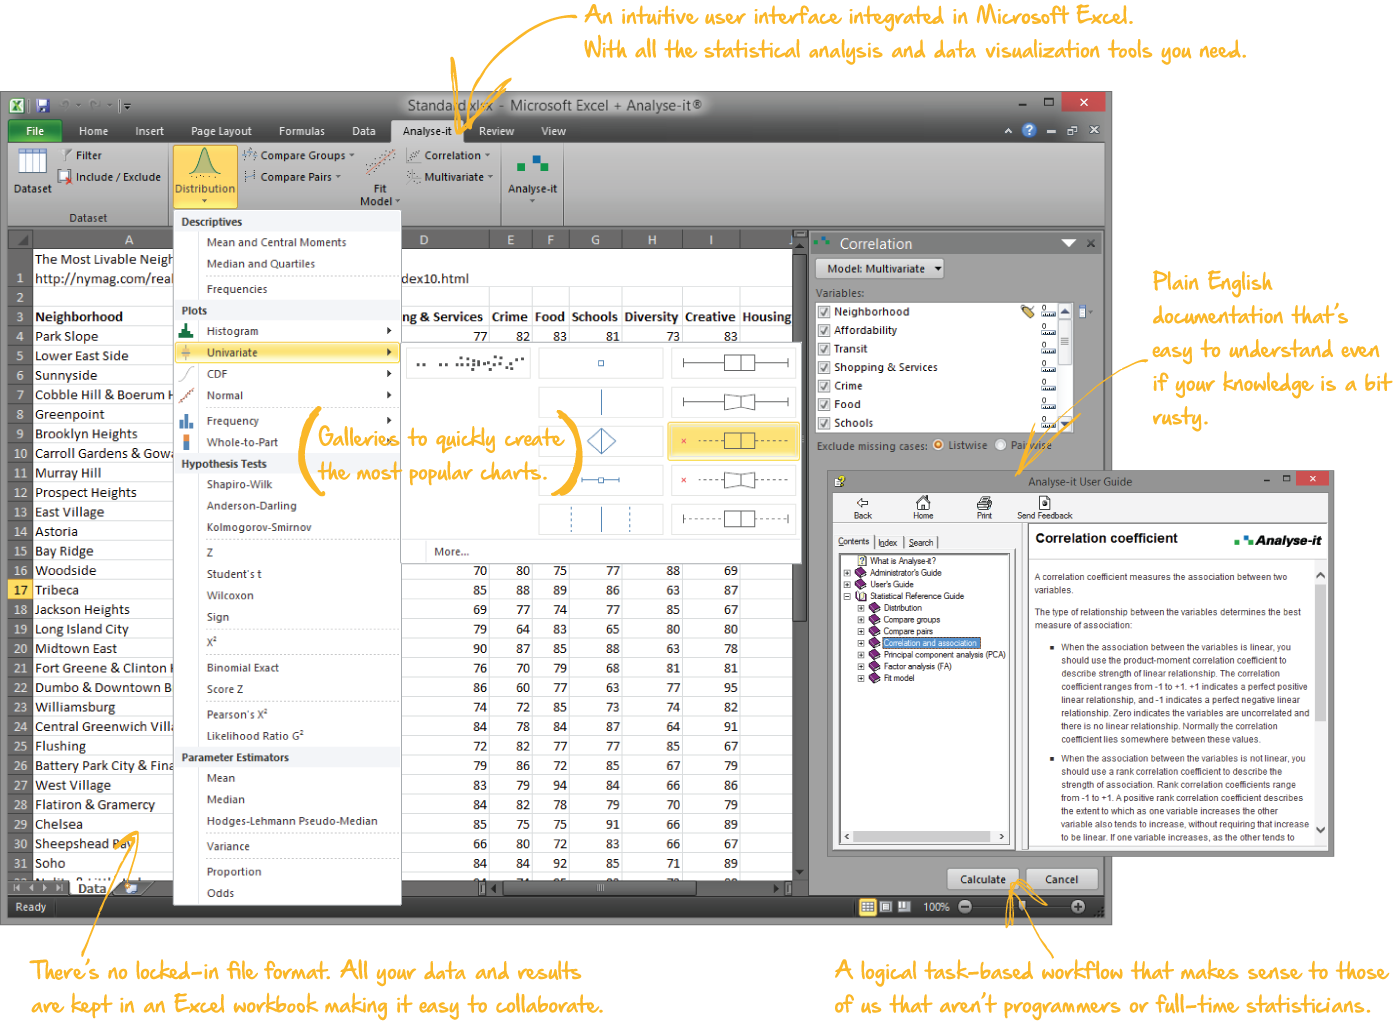
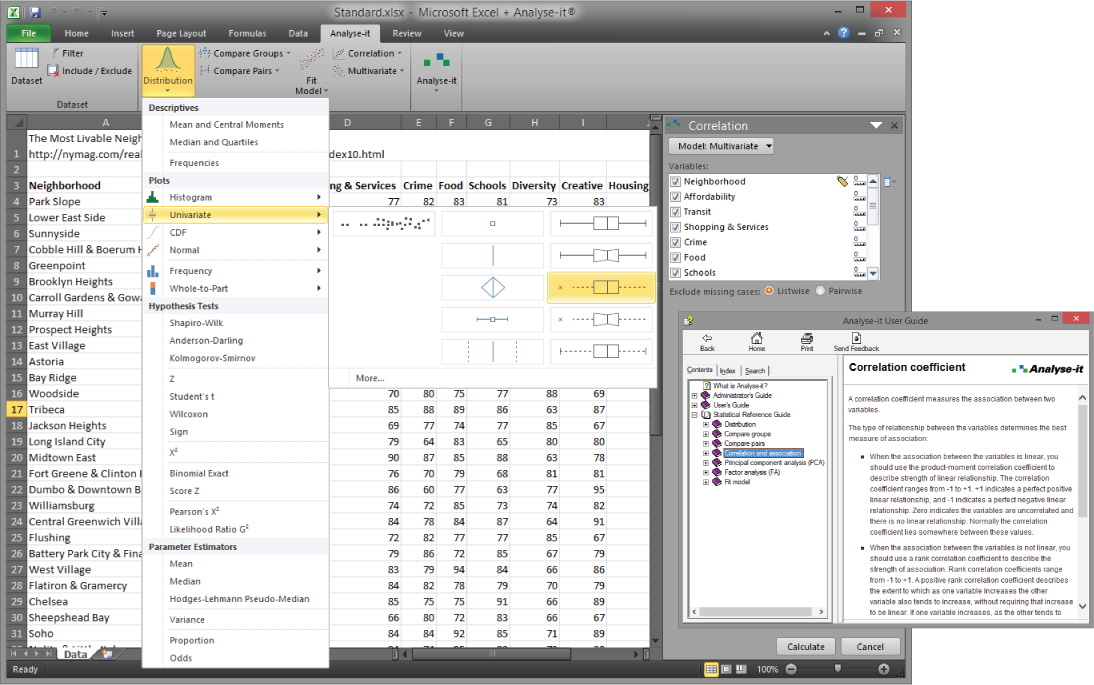
Analyse-it includes over 30 parametric & non-parametric statistics, including descriptive statistics. Analyse-it is fully integrated in Microsoft Excel's user interface and therefore easy to access. Microsoft Excel is an excellent tool for data capture, charting and analysis. It's used throughout the world in every industry imaginable. Add the Analyse-it statistics add-in, and you have powerful statistical analysis tool - with all the power of Excel - and statistical analysis capabilities to rival the best statistics packages available. Except the other statistics packages are expensive, unfriendly, and - unless you're a statistician - difficult to use!

With most new statistical analysis software, there's a lot to learn before you can start using it effectively. Not with Analyse-it. It fits into the way you work now -- simply as a plug-in to Microsoft Excel: it loads with Excel, takes your data straight from Excel worksheets, and presents the statistics in Excel. If you already use Microsoft Excel there's virtually nothing new to learn! No new training! Call on all Excel's familiar features, now with the power of the Analyse-it to dig deeper into your data.

Harness and Utilize the Full-Power of Microsoft Excel

Imagine all the power of Excel in a statistics package. Other statistics spreadsheets try to emulate Excel, but none even come close to its usability and features: Fonts & colour for presentation, formulas for transformations and calculations, sorting, filtering, even dynamic PivotTables.

With Analyse-it, statistical functions are available directly in Excel!

Accurate, Fast and Validated Statistical Analysis

Analyse data quickly, easily and - most importantly - accurately. Analyse-it is a professionally developed & supported statistical package, written in compiled C++ for lightning fast calculations. Analyse-it doesn't use any of Excel's built-in statistics functions at all. Everything is calculated by the software Analyse-it. All functions are carefully coded to be very accurate. Analyse-it uses reliable algorithms and IEEE 754 double floating-precision, so far the software has been tested in more than 1000 test cases! (learn more about the testing and validating procedure of Analyse-it on the Analyse-it website) With Analyse-it you can be sure every analysis you run is calculated precisely!

If you need to repeat the same analyses every day, week or month, just with new data, then Analyse-it can help. You can re-use saved datasets and reports in future as templates for similar experiments. Just type-in the new data, then click Update All Analyses to re-analyse the data. All the analyses in the workbook are repeated and the reports updated - saving an incredible amount of time!

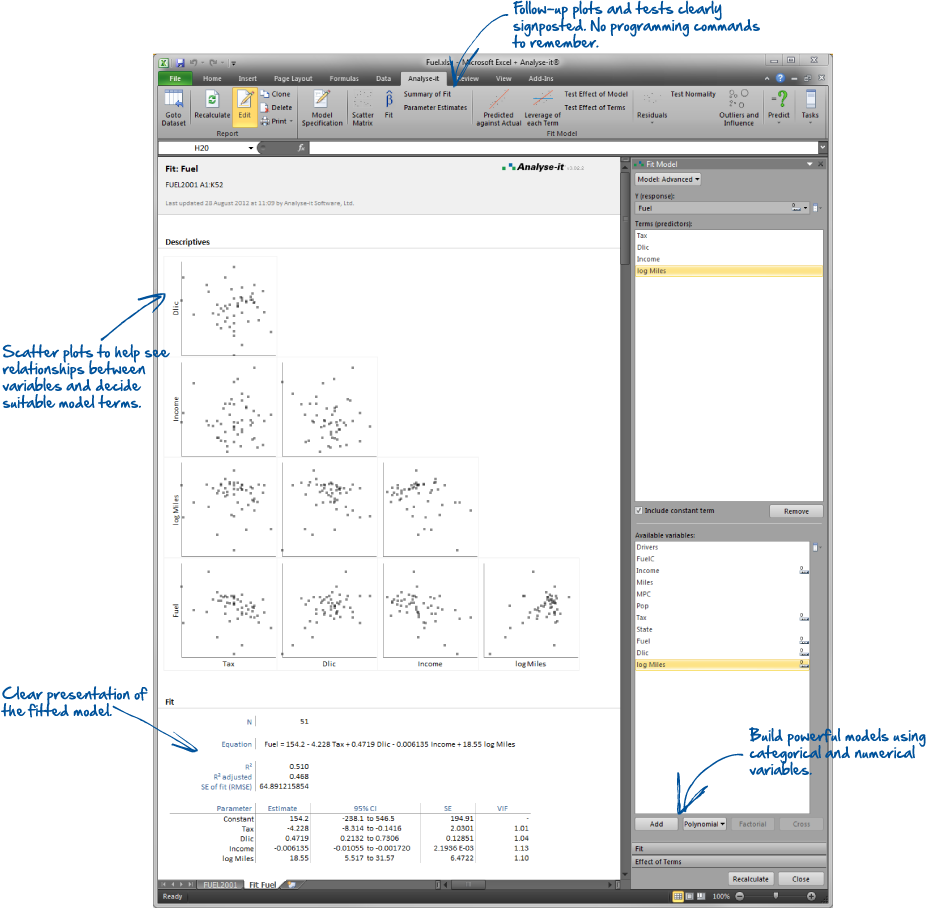
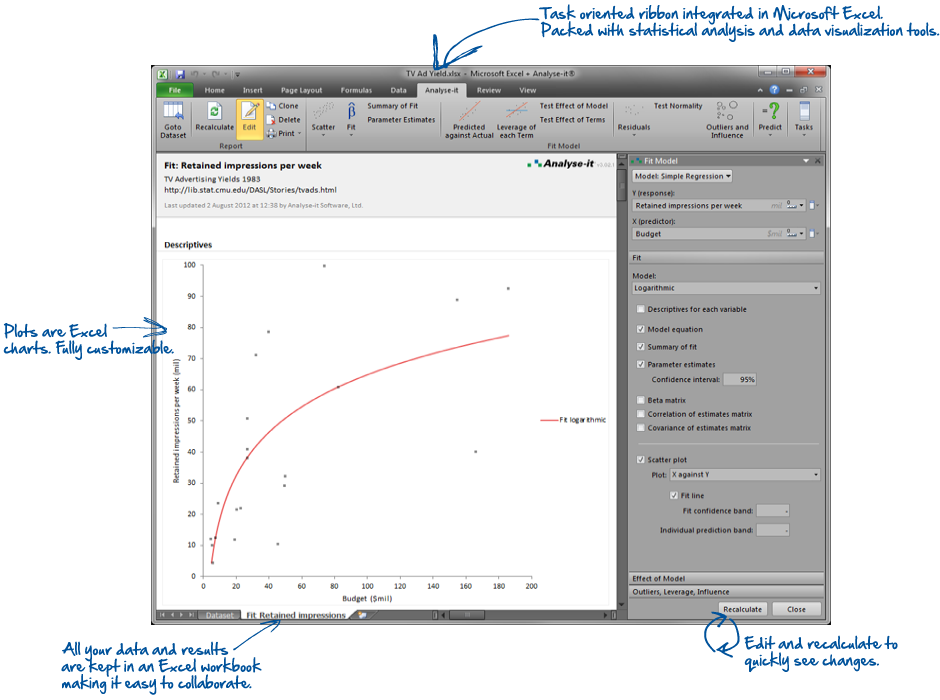
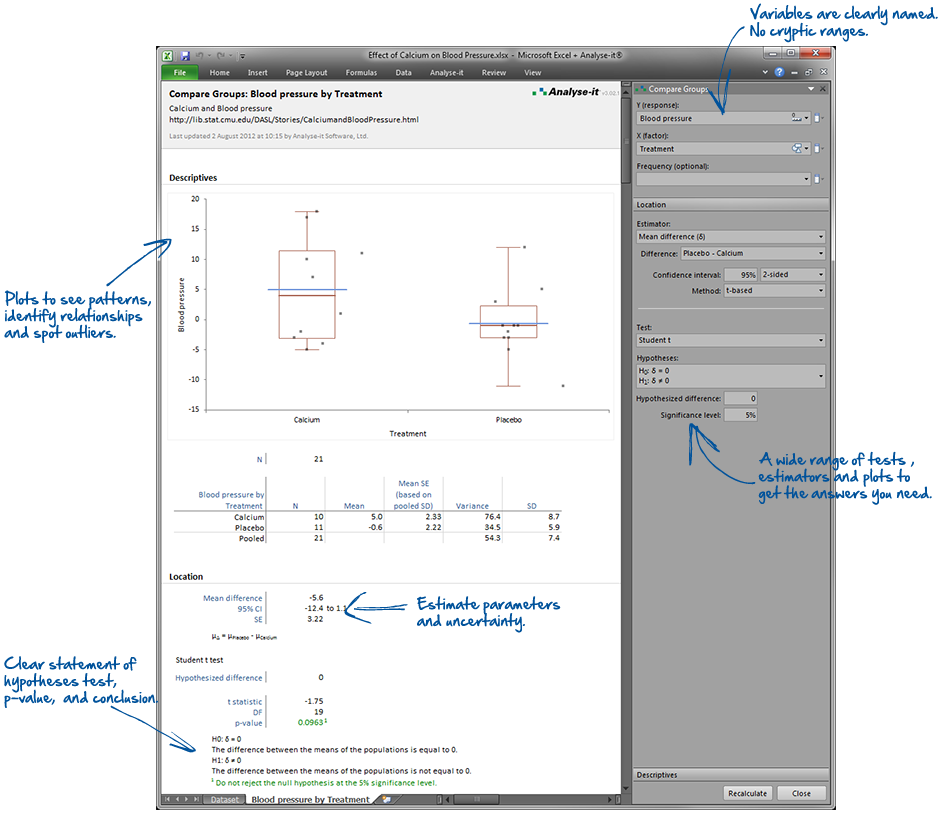
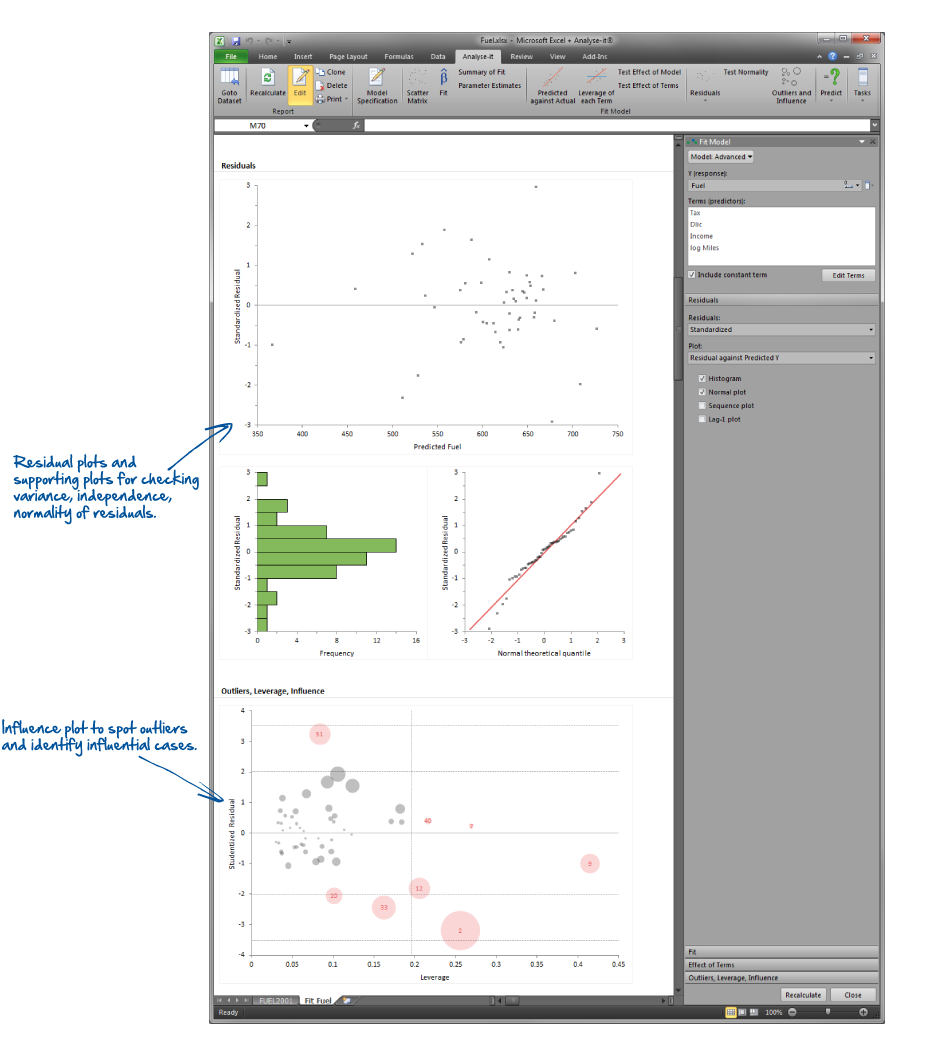
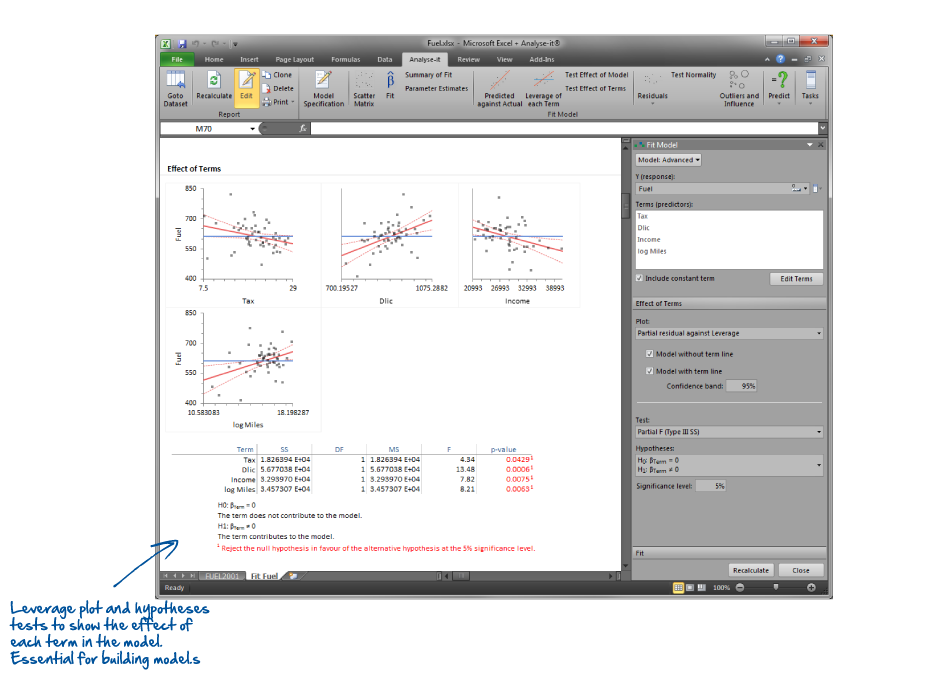
Regression-Analysis, Scatter-Plots and more with an excelent view on the data Leverage-Plots helps you building models within Analyse-it Residual-Plots and Influence-Plots in Analyse-it A wide array of statistical tests, diagramms and functions are directly available in Microsoft Excel thanks to Analyse-it!

Comprehensive Online-Help and Tutorials

Step-by-step tutorials are included to guide you through everything you need to know. The 3 tutorials supplied guide you through data entry, setup, and analysis with demonstrations of descriptive statistics, ANOVA, chi-square, and many other statistical procedures. There are no hefty manuals to wade through, so you'll be up-and-running in "no-time". Click the help button if you're unsure of anything about the test. All the important information - the purpose of the test, when it can be used, and what it tells you - is online, with real-world samples to demonstrate.

Publication-Quality Reports, ready to Print and File

Statistical analysis is time consuming enough without wasting your time formatting the output for presentation. Analyse-it saves you the effort. Statistics are presented to a sensible number of decimal places relative to your data. Plots are standard Excel charts, not static images, with important data points highlighted and labelled so you can easily find them. And page breaks are included so plots and tables don’t split across pages. Just click Print.

Save, Export and Share with Analyse-it

Save analyses in an Excel workbook just like any other Excel worksheet. Then, anyone with Microsoft Excel can view your analysis. Anyone with Analyse-it can recalculate or change your analysis. And anyone can use your analysis as a template for a future analysis - unburdening the statistician and helping colleagues easily run common analyses. If you need a custom report or presentation, simply copy and paste statistics, tables and plots into Word, PowerPoint or any other Windows application.

You would like to continue analyzing your data tomorrow, or next week when you have collected more? With Analyse-it, simply save your datasets and reports for a project together in a workbook. You can then return to them days or months later, and continue working where you left off.

Further Information

Download a Free 30-day Trial of Analyse-it!

On the website of Analyse-it you can download a free 30-day trial of the software Analyse-it. The trialversion comes with no limitations in it's features and functions so you can fully test the software. You can find the trialversion on the website of Analyse-it: www.analyse-it.com

System Requirements of Analyse-it

  Windows
Further Requirements Microsoft Excel 2007, 2010, 2013 (32-Bit/64-Bit)
Operating System Microsoft Windows Vista, 7, 8, 10, Server 2003, 2008, 2012, or 2016

2GB RAM minimum recommended, 80MB disk space

Functions of the software Analyse-it

Descriptive statistics

  • Mean, Variance, SD, Skewness, Kurtosis
  • Median, Minimum, Maximum, Range, IQR
  • Quantiles
  • Frequency table
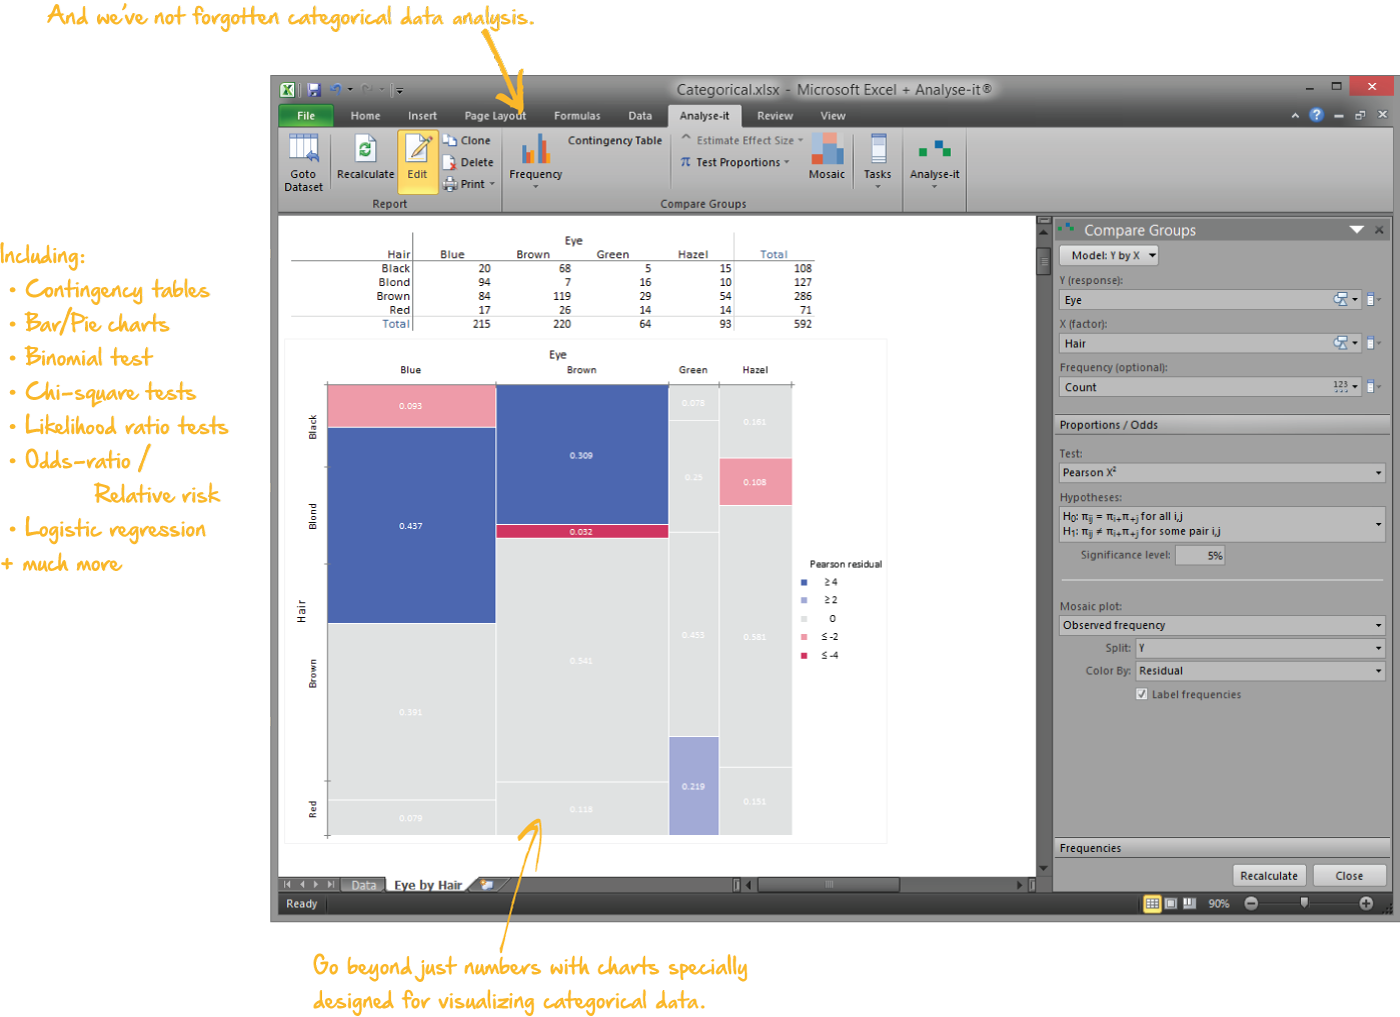
  • Contingency table
  • Correlation coefficient

Multivariate

Correlation

  • Pearson
  • Spearman
  • Kendall
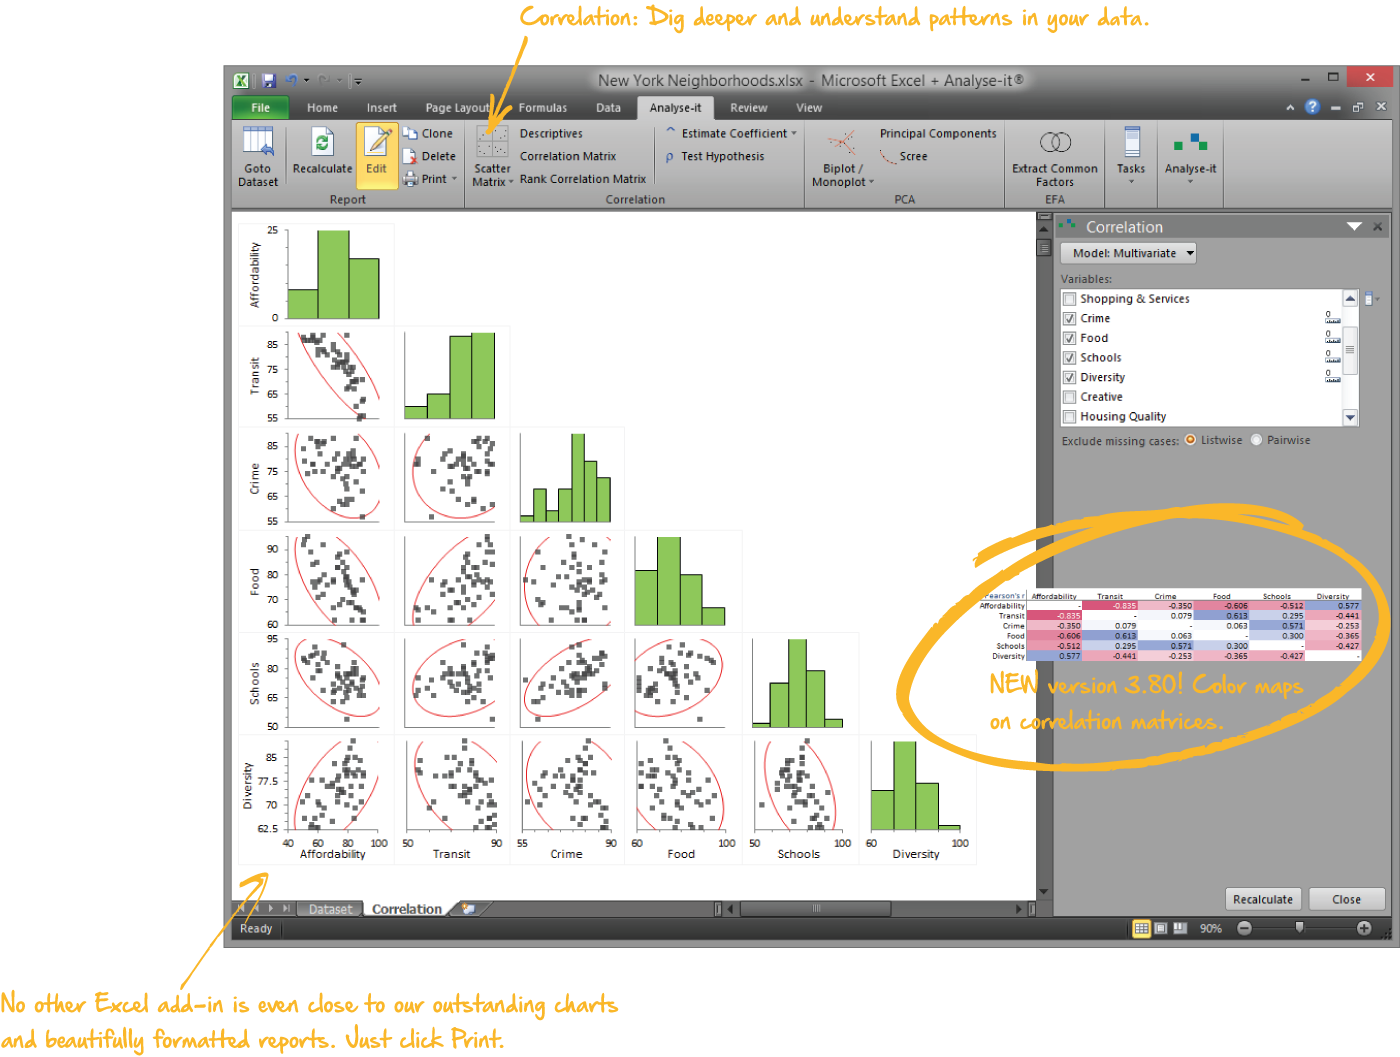
  • Scatter plot matrix

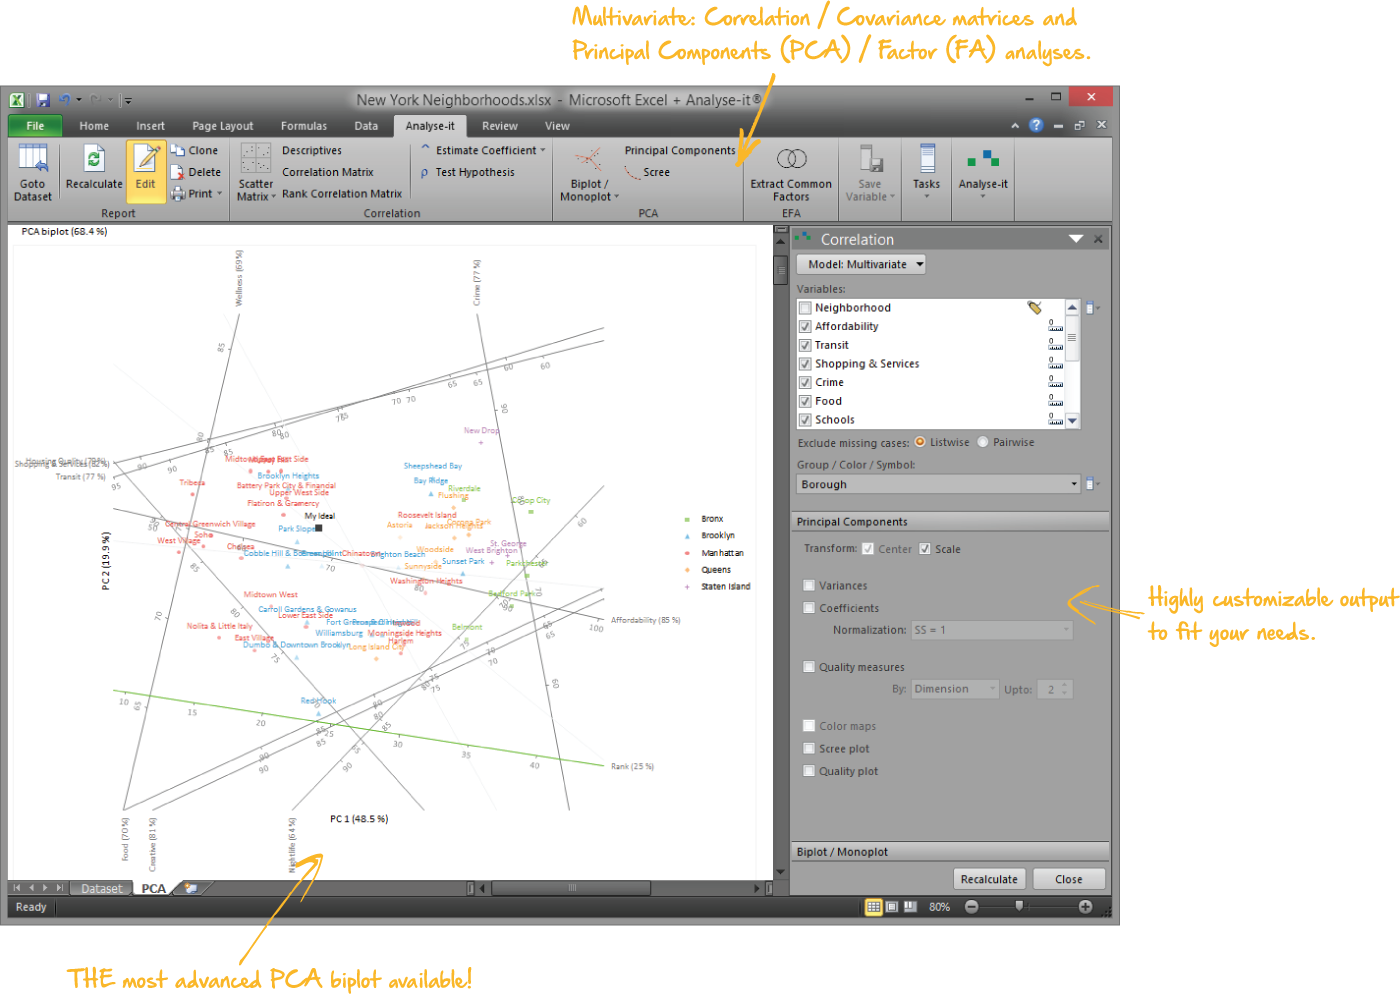
Principal Component Analysis (PCA)

  • Variance, coefficients, scores
  • Scree plot
  • Biplot/Monoplot - PCA/Correlation/Covariance

Modeling and Regression

Linear Fits

  • Simple linear regression
  • Polynomial regression (2nd to 6th order)
  • Logarithmic regression
  • Exponential regression
  • Power regression
  • Multiple linear regression
  • Advanced models with simple, crossed, polynomial and factorial terms, with categorical explanatory variables coded as dummy variables

Other Fits

  • Binary logistic regression
  • Leverage plot
  • Residual plot
  • Outlier and Influence plot
  • Standardized and Studentzied residuals
  • Cook's D
  • Test effect of each term
  • Test effect of model
  • Predict Y for X
  • Lack of fit test for simple regression models
  • Save model variables back to the dataset: Fitted Y, Residuals, Standardized Residuals, Studentized Residuals, Leverage, Cook's Influence.

Hypothesis-Tests

Location

  • Z-test (one, two, paired)
  • Student t-test (one, two, paired)
  • Welch t-test
  • Wilcoxon
  • Wilcoxon-Mann-Whitney
  • Sign
  • ANOVA
  • Repeated measured ANOVA
  • Welch ANOVA
  • Kruskal-Wallis
  • Friedman

Dispersion / Homogeneity of variance

  • X2
  • Fisher F-test
  • Bartlett
  • Levene
  • Brown-Forsythe

Normality

  • Shapiro-Wilk
  • Anderson-Darling
  • Kolmogorov-Smirnov

Association

  • Kendall test
  • Spearman test
  • Pearson test

Proportions

  • Binomial exact
  • McNemar-Mosteller exact
  • Fisher exact
  • Pearson X2
  • Score Z
  • Likelihood ratio G2

Estimators

Location

  • Mean
  • Median
  • Hodges-Lehmann pseudo-median
  • t-based confidence interval for mean
  • Z-based confidence interval for mean
  • Thompson-Savur confidence interval for median
  • Tukey confidence interval for Hodges-Lehmann pseudo-median
  • Mean difference
  • t-based confidence interval for mean difference
  • Z-based confidence interval for mean difference
  • Welch-Satterthwaite t-based confidence interval for mean difference
  • Hodges-Lehmann location shift
  • Tukey confidence interval for Hodges-Lehmann location shift
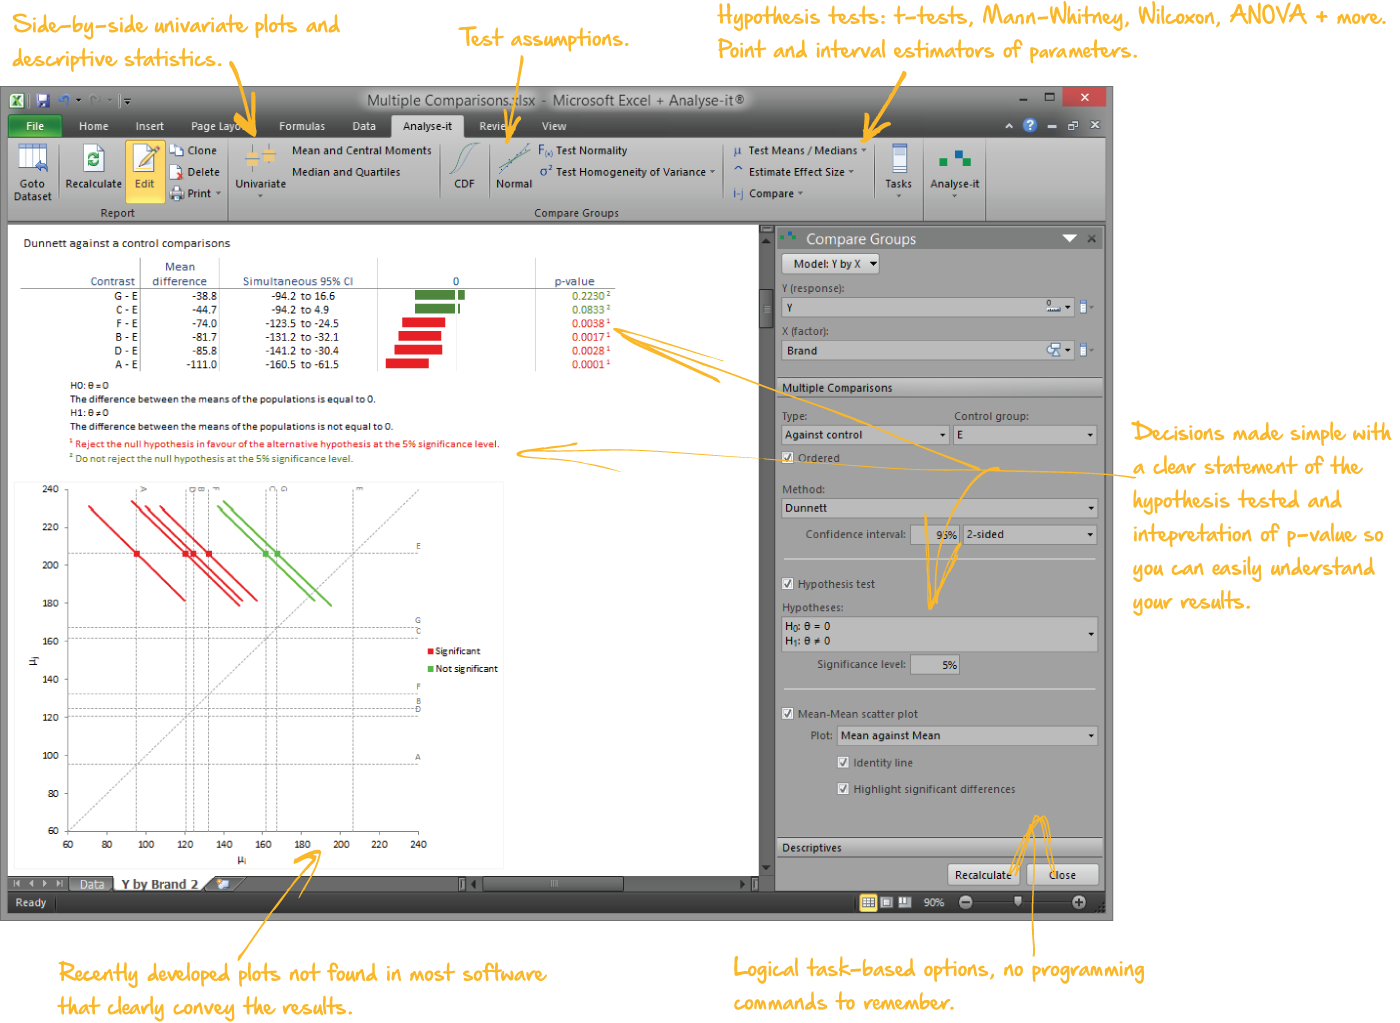
  • Multiple comparisons: Tukey-Kramer, Dunnett, Hsu (with best), Scheffe (all contrasts), Steel (non-parametric against control), Dwass-Steel-Critchlow-Fligner (non-parametric all pairs), Wilcoxon (individual comparisons)

Dispersion

  • Variance
  • X2-based confidence interval for variance
  • Variance ratio
  • F-based confidence interval for variance ratio

Proportions

  • Proportion
  • Odds
  • Clopper-Pearson exact confidence interval for proportion
  • Wilson score confidence interval for proportion
  • Proportion difference (risk difference)
  • Proportion ratio (risk ratio)
  • Odds ratio
  • Miettinen-Nurminen score confidence interval for proportion difference / proportion ratio / odds-ratio
  • Newcombe score confidence interval for proportion difference
  • Conditional exact confidence interval for odds ratio

Correlation

  • Pearson r
  • Fisher Z confidence interval for Pearson r
  • Spearman rs
  • Kendall tau
  • Samara-Randles confidence interval for Kendall tau

Plots

  • Histogram
  • Dot plot
  • Box plot
  • Mean error bar plot
  • CDF plot
  • Normal Q-Q plot
  • Scatter plot
  • Scatter plot matrix
  • Difference plot
  • Mean-Mean scatter plot for visualizing multiple comparisions.
  • Frequency plot
  • Pie frequency plot
  • Mosaic plot
  • Grouped frequency plot
  • Stacked frequency plot