

SigmaStat

SigmaStat is an easy-to-use, wizard-based statistical software package designed to guide users through every step of the analysis and perofrm powerful statistical analysis without being a statistical expert.
SigmaStat finds the most fitting test for your data based on a series on questions. The software ensures that the user always uses the proper statistical method to analyze their data. By performing a check afterwards SigmaStat greatly reduces the risk of staitstical errors in your analysis. In the end SigmaStat is able to generate an appropriated display and a professional report of the process.
Last but not least, the software contains a various amount of different statistical graph designs, interpretations and analysis functions.
SigmaStat
Statistical Software and Advisor
SigmaStat is an easy-to-use, wizard -based statistical software package designed to guide users through every step of the analysis and perform powerful statistical analysis without being a statistical expert.
SigmaStat is tailored to the areas of life science and medical research, but can be a valuable product to scientists in many fields. With SigmaStat, you can be confident that you have analyzed your data correctly.
Because it takes you step by step through the analysis, SigmaStat ensures that you:
use the proper statistical method to analyze your data,avoid the risk of statistical error,
interpret the results correctly,
generate an appropriate display and a professional report
Features that make Analysis fast and easy
You don't need to know which statistical test is right for your data. Simply open the SigmaStat Advisor Wizard and answer a few questions about your data and your research project. The Advisor will suggest the appropriate statistical test. Then SigmaStat runs the test, checking your data against the test's underlying assumptions. If your data violates any of those assumptions, another test may be suggested that you can run immediately. After you run the test, you receive a report in plain English, interpreting the results. Then, with a click of a mouse, you can visualize your data in one of several pre-selected formats
Additional Features
SigmaStat provides additional functions for analysis, interpretation and graphical visualisation of your data.
SigmaStats Report-Editor
When you conduct an analysis with SigmaStat, you receive a detailed, formatted report interpreting the results - not in statistical jargon, but in language you understand. You can print your report, incorporate it into other documents or export it in a variety of formats, including PDF and HTML
SigmaStats Result Graphs
You can instantly visualize the results of your analysis by clicking on one of the preselected graph types suggested by SigmaStat.
SigmaStats Graph Wizard
Simple choose the graph type - point plot, box plot, bar chart, histogram, scatterplot, step plot and more. SigmaStats Graph Wizard will guide you through the process of selecting your data and creating the graph.
SigmaStats Graph Properties-Dialog
Edit every detail of your graph in SigmaStats new Graph Properties-Dialog.
Further Information
Trial Version of the Software SigmaStat
The producer Systat Software provides a free, 30-day valid trial version of the software SigmaStat. Just register yourself on the website of the producer: www.systatsoftware.com
 Download SigmaStat Brochure (on systatsoftware.com)
System Requirements for the Software SigmaStat
SigmaStat 4.0 System
Windows XP, Windows 7, 8.x, 10, Windows Vista:
- 2 GHz 32-bit (x86) or 64-bit (x64) Processor
- 2 GB of System Memory for 32-bit (x86)
- 4 GB of System Memory for 64-bit (x64)
- 200 MB of Available Hard Disk Space
- CD-ROM Drive
- 800×600 SVGA/256 Color Display or better
- Internet Explorer Version 8 or better
Software
- Windows XP, Windows Vista, Windows 7, Windows 8.x, Windows 10; Internet Explorer 8 or higher
- Office 2003 or higher (paste to Powerpoint Slide, Insert Graphs into Word and other macros)
New Functions in Sigmastat
User Interface
- Ribbon-Interface for easier access to program functions
- Rightclick-Menu for a faster access of functions regarding graphs and reports
- Drag and Drop of items within the Notebook-Manager for an improved processing of results
New Statistical Functions
- Principal Components Analysis (PCA)
- One-Way Analysis of Covariance (ANCOVA) with multiple covariances
- Cox-Regression
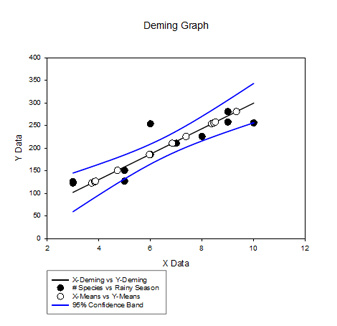
- Deming-Regression
- Odds Ratio and Relative Risk
- One-sample parametric and nonparametric t-Test
- Shapiro-Wilk normality test
- Extensions of multiple comparison-options (added P-Values for Post hoc-tests of nonparametric ANOVAs and presetting significant values for Post hoc-test for each ANOVA)
Improvements to the Transform Language
- 36 new functions for calculating probability distributions
- New features for solving implicit functions
- Quick Transforms-Dialog
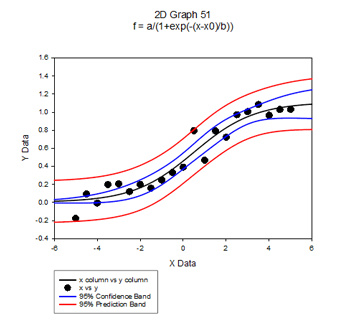
Improvements to Nonlinear Regression
- New wizard interface
- Now uses equation-items in addition to .fit-files for the description of fit models
- Library with predefined fit models
- Added new graph functions in regressions, including confidence bands
- Weighted regression with constant weights or with weights as a function of regression parameters - iterative weighting - useful for robust regression methods
- Comparing the performance of fit models via Akaike information criterion
- New settings in the configuration file stat32.ini for improving convergence and precision at difficult curve fit issues
New Result Graphs
- Profilplots for multifactorial ANOVA
- Graphs for normality tests
- Deming Regression-Fit-Line with confidence bands
- Scree-Plots, Component Loading- and Component Scores-Plot for PCA
- Graphs for Adjusted Means, Confidence Intervals and regression lines for groups of ANCOVA
Improvements of Graph Functions
- Object Properties-Dialog for the adjustments of graphs
- Exporting option on the graph-site to a great varity of bitmap and vektor formats. Graphs can also saved as a website.
- Histogram-Wizard
- Plot Equation-Dialog for graph functions
- Plot Regression-Dialog for adding linear regression lines to graphs